How it Works

The script uses the uncontinuous score from a bigWig file to estimate footprints within the peaks of interest. A sliding window algorithm is used to look through the peaks. A region with a significant high signal will be saved as a footprint. To estimate the significance of a footprint the signal is compared to the mean of the signals within the window. After the run, the footprints are saved in a .bed file.
usage:  [-h] --bigwig BIGWIG --bed BED [--output_file OUTPUT_FILE]
        [--window_length WINDOW_LENGTH] [--step STEP]
        [--percentage PERCENTAGE] [--min_gap MIN_GAP] [--silent]

This script produces a file with footprints in .bed format from the file with
scores in .bigWig format and a corresponding .bed file with peaks of interest.

optional arguments:
  -h, --help            show this help message and exit
  --output_file OUTPUT_FILE
                        The name for the output file, by default
                        ./footprints_extraction.bed.
  --window_length WINDOW_LENGTH
                        The length for a window, by defauld 200 bp.
  --step STEP           Stepsize for moving the window, by default 100 bp.
  --percentage PERCENTAGE
                        The percentage to be added to background while
                        searching for footprints, by default 0%.
  --min_gap MIN_GAP     The number of bp allowed to be in between two
                        footprints, by default 6 bp.
  --silent              While working with data write the information only
                        into ./footprints_extraction.log.

required arguments:
  --bigwig BIGWIG       A path to the bigWig-file with scores.
  --bed BED             A path to the file with peaks in .bed format.
While using this script on its own, the user can set the name for an output .bed file using the parameter --output_file. By default, the output file is called footprints_extraction_output.bed and is saved to the working directory. When the whole pipeline is run, the default name will be used for the output file to save it as an intermediate result.
For each footprint, an individual score is returned. The score shows the footprints quality and is computed as the mean of the corresponding position signals from the bigWig file. The output .bed file has 8 columns and a header marked with #.
#chr start end name score len max_pos bonus_info
| Column | Description |
|---|---|
| chr | Chromosome name. |
| start | Start position of the footprint. |
| end | End position of the footprint. |
| name | Unique name of the footprint. |
| score | Quality of the footprint. |
| strand | Strand of the footprint. |
| len | Length of the footprint. |
| max_pos | Relative position within the footprint, where the highest signal from the bigWig file is (if there are several maximum positions set the mean as max_pos). |
| bonus_info | Additional information from the input .bed file. |
If some information could not be defined, a '.' will be written in the corresponding row and column. For example, if there was no additional information the bonus_info column would still be created but filled with '.'.
Changing parameters can lead to varying numbers of found footprints and their length. For example, the following picture shows three files. The first one is the .bigwig file with the signal. The second is the output file produced with the parameter --percentage set to 10, and the third is the output file produced with --percentage 0.
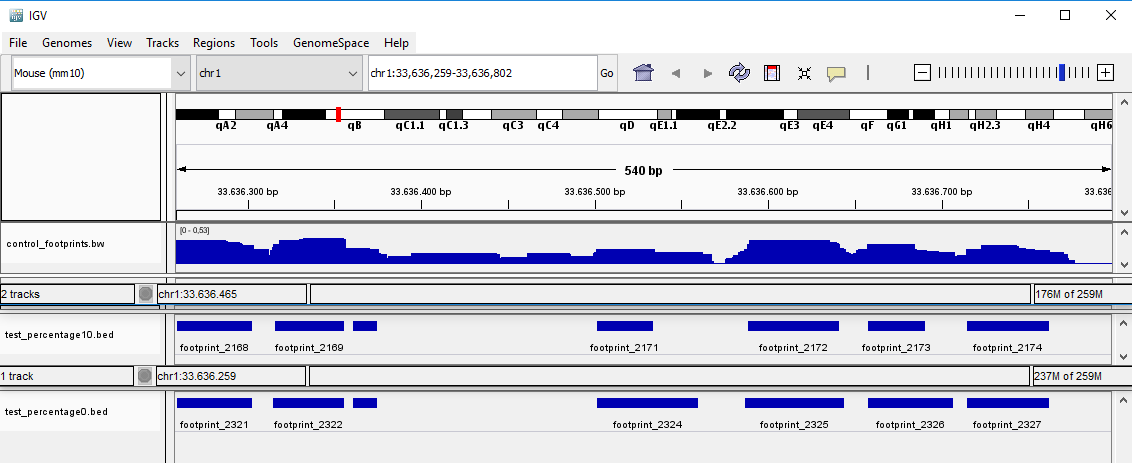
The smaller --percentage is set, the longer the found footprints will be, in exchange reducing the quality of each footprint. The window size has also an impact on the length of found footprints. The bigger the --window_len, the longer the footprint length will be, though this change is not as remarkable as changing the --percentage parameter.
The maximum allowed number of base pairs in between two footprints can be set with the parameter --min_gap. By default 6 bp are allowed. This means, all footprints, which have a smaller number of footprints between each other, will be merged. The score for a merged footprint is calculated as the mean of scores of the original footprints. If the user doesn't want to merge the footprints, the --min_gap should be set to 1.
Footprints detected in the peak calling step 1.1 can belong to already annotated or to new, unknown motifs. This step (1.2) removes sequences in the footprints that are present in a set of known motifs.
The filtering is done utilizing bedtools subtract. Non overlapping sequences pass the filter, if they are longer than a minimum length and shorter than the maximum length. The known motifs can either be calculated within this pipeline or the path to the directory where the known motifs .bed files are stored can be submitted.
Required arguments are data, motifs, both in bed-format and the fasta genome sequences.
If a parameter is chosen, a value must be provided aswell. (exception -h)
--------------------
usage: compareBed.sh --data <path/to/file.bed> --motifs <path/to/known/motifs.bed> --fasta <path/to/genome.fasta> [optional_parameter <value>] ...
--------------------
              required parameters:
              -d   --data         The path to the .bed file of the footprints (9 or more column .bed file required).
              -m   --motifs       Either the path to the directory where the .bed files of the scanned motifs are stored.
                                  Or a comma seperated list of files, e.g.: path1/file1,path2/file2,path3/file3
              -f   --fasta        the path to the .fasta file of genome

              optional parameters:
              -w   --workdir      The path to directory where temporary files will be created.
                                  Default is the current directory.
              -min --min          Minimum size of footprints; default is 10.
              -max --max          Maximum size of footprints; default is 200.
              -o   --output       Output path/file ; default dir current directory and filename is newMotifs.bed and newMotifs.bed.fasta.
              -h --help           shows this help message

 Note: file paths must not contain the '|' pipe symbol
The output .bed file contains the same information as the output file from 1.1 but with two added columns:
- a flag with possible values 1 or 0. Whether the maximum score of the original footprint lies inside (1) or outside (0) after filtering.
- the DNA sequence.
Further a summary file called compareBed.log with information about the run is created.
| Row | Description |
|---|---|
| sum_nt_input | the total count of nucleotides of all footprints in the input data |
| sum_nt_filtered | the total count of nucleotides of all footprints in the output data |
| quotient_of_nt | sum_nt_input / sum_nt_output |
| loss_of_nt | 1 - sum_nt_output / sum_nt_input |
| mean_length_input | Mean sequences length of input file. |
| mean_length_filtered | Mean sequence length after filtering. |
| flag_1_ratio | flag 1 count / number of entries |
| initial number of footprints | Number of footprints in input file. |
| number of footprints after subtract | Number of footprints in output file. |

As shown in the picture above the input footprints are compared to the known motifs. Through this process only fragments which do not overlapp with any of the known motifs and are longer than a given threshold (parameter: min) are kept. If a single footprint is splitt into multiple parts a suffix is added to its name to keep it unique.
The remaining footprints from the previous step are now clustered for later motif generation. This process is divided into sequence reduction and the actual clustering. For reduction each of the given sequences (= footprints) is shortened to a conserved region resulting in an overall reduced background noise in the data. This is necessary since motifs, due to their size, cover only a small portion of the footprint. Thereafter CD-HIT is utilized for clustering.
Reducing given sequences to dense regions is crucial to produce clean clusters subsequently. This is done with a k-mer approach through the following steps: 1. Count k-mer 2. Compute k-mer cutoff and remove k-mer below this cutoff 3. Find positions of remaining k-mer on each sequence 4. Merge overlapping k-mer 5. Reduce each sequence to it's best region
The cutoff is calculated by assuming that 100% (parameter: -f) of the sequences contain a motif of set length (parameter: -m). Now with the length of each sequence it can be computed how many k-mer positions are possible that overlap at least half of the motif (parameter: -v). This results in the number of interesting k-mer over the whole dataset.

Then the k-mer are ordered descending after their count and the cumulative sum is calculated. All k-mer with a cumulative sum below the threshold are kept and the ones above discarded.

After the k-mer are reduced to significant ones they are compared back to the original sequences. For each sequence k-mer that overlap with at least k-mer - 1 nucleotides (parameter: -n) are merged to a single component. Those components consisting of one or more k-mer are then compared and the component with the highest score is used as the reduced sequence. The score of each component is the sum of counts of all their k-mer. If a sequence contains no k-mer it will be removed.

Basic command:
Rscript reduce_sequence.R -i input.bed
Parameters:
Usage: reduce_sequence.R [options]
Reduces each sequence to its most frequent region.

Options:
        -i CHARACTER, --input=CHARACTER
                Input bed-file. Last column must be sequences.

        -k INTEGER, --kmer=INTEGER
                K-mer length. Default = 10

        -m INTEGER, --motif=INTEGER
                Estimated motif length. Default = 10

        -o CHARACTER, --output=CHARACTER
                Output file. Default = reduced.bed

        -t INTEGER, --threads=INTEGER
                Number of threads to use. Use 0 for all available cores. Default = 1

        -c LOGICAL, --clean=LOGICAL
                Delete all temporary files. Default = TRUE

        -s INTEGER, --min_seq_length=INTEGER
                Remove sequences below this length. Defaults to the maximum value of motif and k-mer and can not be lower.

        -n INTEGER, --minoverlap_kmer=INTEGER
                Minimum required overlap between k-mer. Used to create reduced sequence ranges out of merged k-mer. Can not be greater than k-mer length. Default = kmer - 1

        -v INTEGER, --minoverlap_motif=INTEGER
                Minimum required overlap between motif and k-mer to consider k-mer significant. Used for k-mer cutoff calculation. Can not be greater than motif and k-mer length. Default = ceiling(motif / 2)

        -f DOUBLE, --motif_occurrence=DOUBLE
                Define how many motifs are expected per sequence. This value is used during k-mer cutoff calculation. Default = 1 meaning that there should be approximately one motif per sequence.

        --summary=CHARACTER
                Filepath where a small summary file of the run should be written. Default = NULL

        -h, --help
                Show this help message and exit

Author: Hendrik Schultheis <Hendrik.Schultheis@mpi-bn.mpg.de>
The clustering script takes a bed-file as input and appends a column with cluster numbers. It is mostly a wrapper function for CD-HIT-EST with new default parameters for this specific pipeline.
Basic command:
Rscript cdhit_wrapper.R -i input.bed
Parameters:
Usage: cdhit_wrapper.R [options]
CD-HIT-EST Wrapper function. See https://github.com/weizhongli/cdhit/wiki for more information regarding CD-HITs parameters.

Options:
        -i CHARACTER, --input=CHARACTER
                Input bed-file. Fourth column is expected to contain names, last column must be sequences.

        -c DOUBLE >= 0.8, --identity=DOUBLE >= 0.8
                Identity threshold. Default = 0.8 (CD-HIT parameter)

        -A INTEGER, --coverage=INTEGER
                Minimal alignment length for both sequences in nucleotides. Default = 8 (CD-HIT parameter)

        -o CHARACTER, --output=CHARACTER
                Output file same as input but with appended column of cluster numbers. Default = cluster.bed

        --clean=LOGICAL
                Delete all temporary files. Default = TRUE

        -G INTEGER, --global=INTEGER
                Global sequence identity = 1, local = 0. Default = 0 (CD-HIT parameter)

        -b INTEGER, --band_width=INTEGER
                Alignment band width. Default = 20 (CD-HIT parameter)

        -M INTEGER, --memory=INTEGER
                Memory limit in MB. 0 for unlimited. Default = 800 (CD-HIT parameter)

        -T INTEGER, --threads=INTEGER
                Number of threads. Default = 1 (CD-HIT parameter)

        -n INTEGER, --word_length=INTEGER
                Default = 3 (CD-HIT parameter)

        -l INTEGER, --throw_away_sequences=INTEGER
                Maximum length of sequences thrown away. Default = 5 (CD-HIT parameter)

        -s DOUBLE, --length_dif_cutoff_shorter_p=DOUBLE
                Shorter sequences length must be at least x percent of longer sequences length. Default = 0 (CD-HIT parameter)

        -S INTEGER, --length_dif_cutoff_shorter_n=INTEGER
                Length difference between sequences can not be higher than x nucleotides. Default = 999999 (CD-HIT parameter)

        -e DOUBLE, --alignment_coverage_longer_p=DOUBLE
                Alignment must cover x percent of longer sequence. Default = 0 (CD-HIT parameter: -aL)

        -E INTEGER, --alignment_coverage_longer_n=INTEGER
                There can not be more than x unaligned nucleotides on the longer sequence. Default = 99999999 (CD-HIT parameter: -AL)

        -f DOUBLE, --alignment_coverage_shorter_p=DOUBLE
                Alignment must cover x percent of shorter sequence. Default = 0 (CD-HIT parameter: -aS)

        -F INTEGER, --alignment_coverage_shorter_n=INTEGER
                There can not be more than x unaligned nucleotides on the longer sequence. Default = 99999999 (CD-HIT parameter: -AS)

        -w DOUBLE, --max_unmatched_longer_p=DOUBLE
                Maximum unmatched percentage on longer sequence (excludes leading tailing gap). Default = 1 (CD-HIT parameter: -uL)

        -W DOUBLE, --max_unmatched_shorter_p=DOUBLE
                Maximum unmatched percentage on shorter sequence (excludes leading tailing gap). Default = 1 (CD-HIT parameter: -uS)

        -U INTEGER, --max_unmatched_both_n=INTEGER
                Maximum unmatched nucleotide on both sequences (excludes leading tailing gap). Default = 99999999 (CD-HIT parameter)

        -g INTEGER, --fast_cluster=INTEGER
                Cluster sequence in first cluster that meets threshold = 0 (fast). Or cluster in best Cluster = 1 (accurate). Default = 1 (CD-HIT parameter)

        -r INTEGER, --strand=INTEGER
                Align +/+ & +/- (= 1). Or align only +/+ (= 0). Default = 0 (CD-HIT parameter)

        --match=INTEGER
                Matching score. Default = 2 (CD-HIT parameter)

        --mismatch=INTEGER
                Mismatch score. Default = -2 (CD-HIT parameter)

        --gap=INTEGER
                Gap score. Default = -6 (CD-HIT parameter)

        --gap_ext=INTEGER
                Gap extension score. Default = -1 (CD-HIT parameter)

        -x INTEGER, --sort_cluster_by_size=INTEGER
                Either sort cluster by decreasing length (= 0) or by decreasing size (= 1). Default = 1 (CD-HIT parameter: -sc)

        --summary=CHARACTER
                Filepath where a small summary file of the run should be written. Default = NULL

        -h, --help
                Show this help message and exit

Author: Hendrik Schultheis <Hendrik.Schultheis@mpi-bn.mpg.de>
The process BED_to_FASTA calls the R-script bed_to_fasta.R, which extracts the sequences from a given BED-file and creates a FASTA-file per cluster. The cluster is given by an additional column in the BED-file.
Usage: bed_to_fasta.R [options]
Convert BED-file to one FASTA-file per cluster.

Options:
        -i CHARACTER, --input=CHARACTER
                Input bed-file. Second last column must be sequences and last column must be the cluster id.

        -p CHARACTER, --prefix=CHARACTER
                Prefix for file names. Default = ''

        -m INTEGER, --min_seq=INTEGER
                Minimum amount of sequences in clusters. Default = 100

        -h, --help
                Show this help message and exit
The process GLAM2 uses the FASTA-files created from BED_to_FASTA as input and calls GLAM2. GLAM2 is a tool provided inside the MEME Suite. "GLAM2 is a program for finding motifs in sequences, typically amino-acid or nucleotide sequences. The main innovation of GLAM2 is that it allows insertions and deletions in motifs." GLAM2 uses Dirichlet processes to align the sequences and find motifs inside the sequences. GLAM2, by default, generates ten motifs per cluster. The output is a MEME-file for each cluster, which contains all ten motifs.
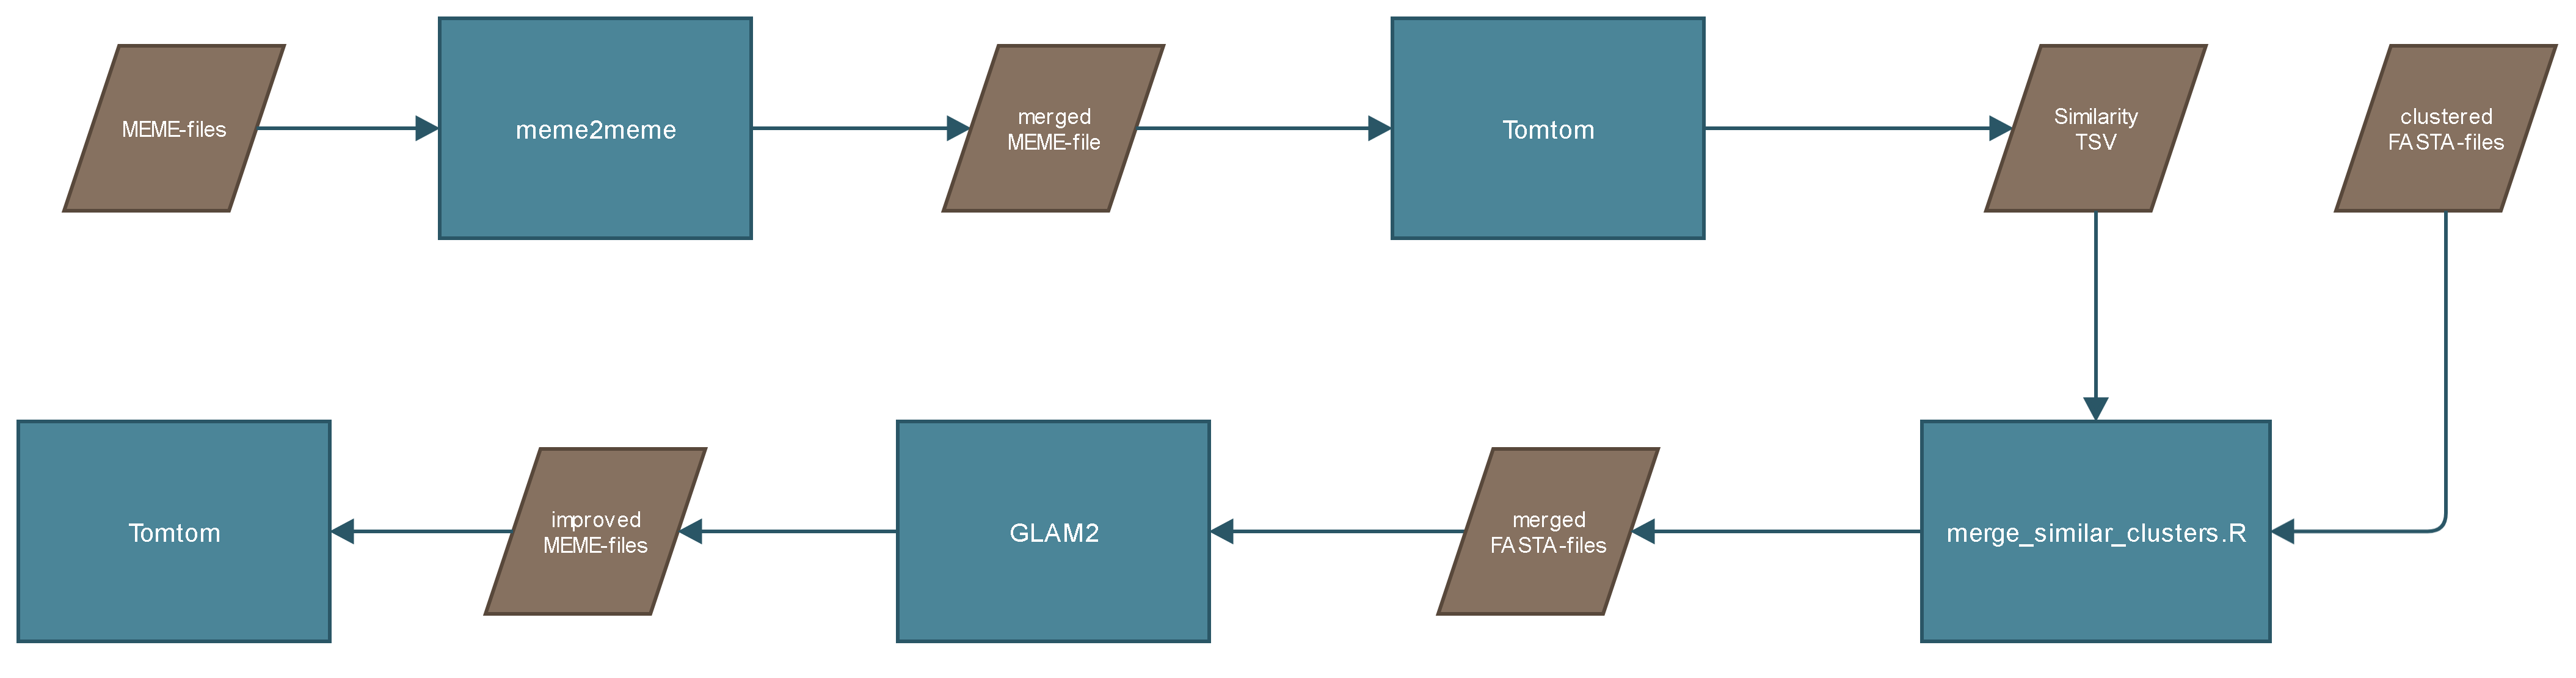
Because the previous clustering step does not create perfect clusters. The motifs created from GLAM2 are clustered. To cluster the motifs all MEME-files are merged with meme2meme, a tool provided inside the MEME Suite. The merged MEME-file is compared with itself by Tomtom. Tomtom is a tool provided inside the MEME Suite and "compares one or more motifs against a database of motifs (e.g., JASPAR). Tomtom will rank the motifs in the database and produce an alignment for each significant match". The similarity between the motifs gives information about the cluster similarity. The output would look something like this:

The first two columns are the important ones. Both columns contain two numbers separated by a dot (e.g. 1.1 or 2.10). The first number stands for the motif number. The second number stands for the cluster number. So '2.10' means that its the second motif from the tenth cluster. Looking at the fifth row the information you get from it is that motif 1 from cluster 1 is similar to motif 5 from cluster 3, which supposes that cluster 1 is similar to cluster 3.
The cluster numbers are extracted from the file, which creates a table with two columns. This table can be interpreted as an edge-list for creating a weighted graph. Before creating the graph identical column values are removed:

Ideally, the graph forms clusters:

Depending on those improved clusters the FASTA-files from corresponding clusters are merged. The merged FASTA-files are given to GLAM2 to find the further improved motifs.
The process Tomtom gets the MEME-files from the Motif clustering and a database with known motifs as input. It compares the Motifs to a Motif-database with Tomtom.
If tomtom can find the motif in the database the cluster is sorted out. This is done with groovy inside the nextflow script. No separate script is called for this action.
GLAM2 does not format its output files in the right MEME-format. The script get_best_motif.py converts the files to the correct MEME-format. It also saves only the best X (Default: 3) Motifs.
usage: get_best_motif.py [-h] meme output num id

A script to convert from GLAM2 output to MEME-format and parsing only the
[num] first motifs from file to the output.

positional arguments:
  meme        Path to 'meme' file generated by GLAM2
  output      Output file
  num         Number of motifs parsed from file
  id          Cluster ID (used for naming the motifs)

optional arguments:
  -h, --help  show this help message and exit
Parallel to get_best_motif the script get_motif_seq_id.R is called. This script creates a JSON-file which contains the sequence names, which were used by GLAM2 to create the motifs.
Usage: get_motif_seq_id.R [options]
Creating JSON-file with sequence ids which were used to create the best [num] motifs.

Options:
        -i CHARACTER, --input=CHARACTER
                Input file. Output txt-file from GLAM2.

        -o CHARACTER, --output=CHARACTER
                Output JSON-file. Default = 'sequences.json'

        -n NUMERIC, --num=NUMERIC
                Get best [num] motifs. Default = '3'

        -c NUMERIC, --cluster_id=NUMERIC
                Cluster ID

        -t CHARACTER, --tmp=CHARACTER
                Path for tmp-files. Default = './'

        -h, --help
                Show this help message and exit
The GTF-Creation-Tool (RegGTFExtractor) creates GTF-Files with regulatory features based on the source organism. For this, it utilizes the Ensembl Regulatory Build and the RefSeq-FuncElem-Track from UCSC Table-Browser to gather data for regulatory features. The extracted data is saved in a GTF-formatted file. Additionally, activity data for different tissue types (based on JSON config) is gathered and added to the attributes field from the output file. Supported organism assemblies are: human: hg19, hg38, mouse: mm9, mm10. The regulation data is always extracted for the current assembly version (hg38 and mm10), if an older version is chosen (hg19 or mm9) the resulting GTF-output is automatically converted via CrossMap.
usage: RegGTFExtractor.py [-h] [--tissue [TISSUE [TISSUE ...]]] [--wd WD]
                          [--dir DIR] [--out OUT]
                          [organism]

GTF-Generator from UCSC Table Browser and Ensembl Regulatory Build

positional arguments:
  organism              Source organism [ hg19 | hg38 or mm9 | mm10 ]

optional arguments:
  -h, --help            show this help message and exit
  --tissue [TISSUE [TISSUE ...]]
                        Tissue- or Celltype(s)
  --wd WD               Working directory. default: "."
  --dir DIR             Data directory. default: "working_directory"
  --out OUT             Path to output file: default: "./organism.gtf"
The Results have a customizable activity-list in their attributes field. This list is changed via config. The config is in JSON-Format, and contains a list of category-elements with three fields:
- type = Name of the category
- alias_ucsc = Aliasname in UCSC datafiles (Name of the folder in activity subfolder)
- alias_ensembl = Aliasname in Ensembl datafiles (Alias from UCSC Bed-file)
The config can be found and changed in the ./bin/3.1_create_gtf/config/ directory.
Example:

The activity can have the following status, based on Ensembl scheme:
- ACTIVE
- POISED
- REPRESSED
- INACTIVE
- NA
If multiple aliases are assigned to the same category, the activity will get the "highest" activity status. The order for activity is listed above. Only the highest activity will count. e.g. if in a feature one alias is ACTIVE and the other INACTIVE, the result will be noted as ACTIVE.
The resulting File is in GTF-Format. In which each line contains one regulatory feature. It has the following columns, with no header:
[chromosome] [source] [feature] [start] [end] [score] [strand] [frame] [list of attributes]
Example Results:

In the attributes field are the two values: gene_id (Ensemble: ENSR-ID or UCSC: RefSeq-ID) and activity: a list of categories from config with their activity-status for this feature. If cross-mapping is enabled and an older assembly version is chosen, in addition to the resulting GTF-File a ".unmap" file is created, this file contains entries from the original file that could not be found in the older assembly version.
The gtf created in part 3.1 is merged with the given gtf annotation file (e.g. ensembl mainChr). The merged gtf is sorted and passed to UROPA. If a final gtf-file already exists part 3.1 and the merging can be skipped by giving the gtf_merged parameter the path to the final gtf-file.
In the evaluation step we want to collect all sites from the genome where the potenial de novo motifs (from step 2.2) align. The amount of found sites and overlaps with the sequences from the motif gives insight on the information value of the motif. The last step is to annotate the found sites.
The re-scan step uses tfbsscan to look for the new found motifs (from step 2.2) in a given genome. A BED-file for each cluster is created, which contains all found sites.
This process calls the venn.R script. It compares the sequences which created the motif for a given cluster with by re-scan found locations on the genome. It creates a Venn diagram of both sequences.

Blue: Related motif sites of the cluster.
Red: New locations found with re_scan.
The more they overlap the better is the result. The blue circle contains all sequences used to create the motif, which is searched against the genome. If they overlap completely it means that all sequences could be found again.
Usage: venn.R [-[-cluster_dir|i] <character>] [-[-pattern|p] <character>] [-[-seq_dir|l] <character>] [-[-clustered_fp|c] <character>] [-[-outdir|o] <character>] [-[-help|h]]
    -i|--cluster_dir     directory with rescan results
    -p|--pattern         cluster pattern, e.g. 'Cluster_96'
    -l|--seq_dir         directory with fp assignment per cluster (JSON)
    -c|--clustered_fp    clustering results (BED)
    -o|--outdir          output directory
    -h|--help            Provides command line help
This process uses UROPA to annotate the regions found by re-scan. "UROPA is a command line based tool, intended for genomic region annotation". UROPA gets a JSON-configuration file as input, in which you can set the parameter for the annotation.