ChIP-Seq / ATAC-Seq
Protein Binding / Accessible Chromatin
Challenges
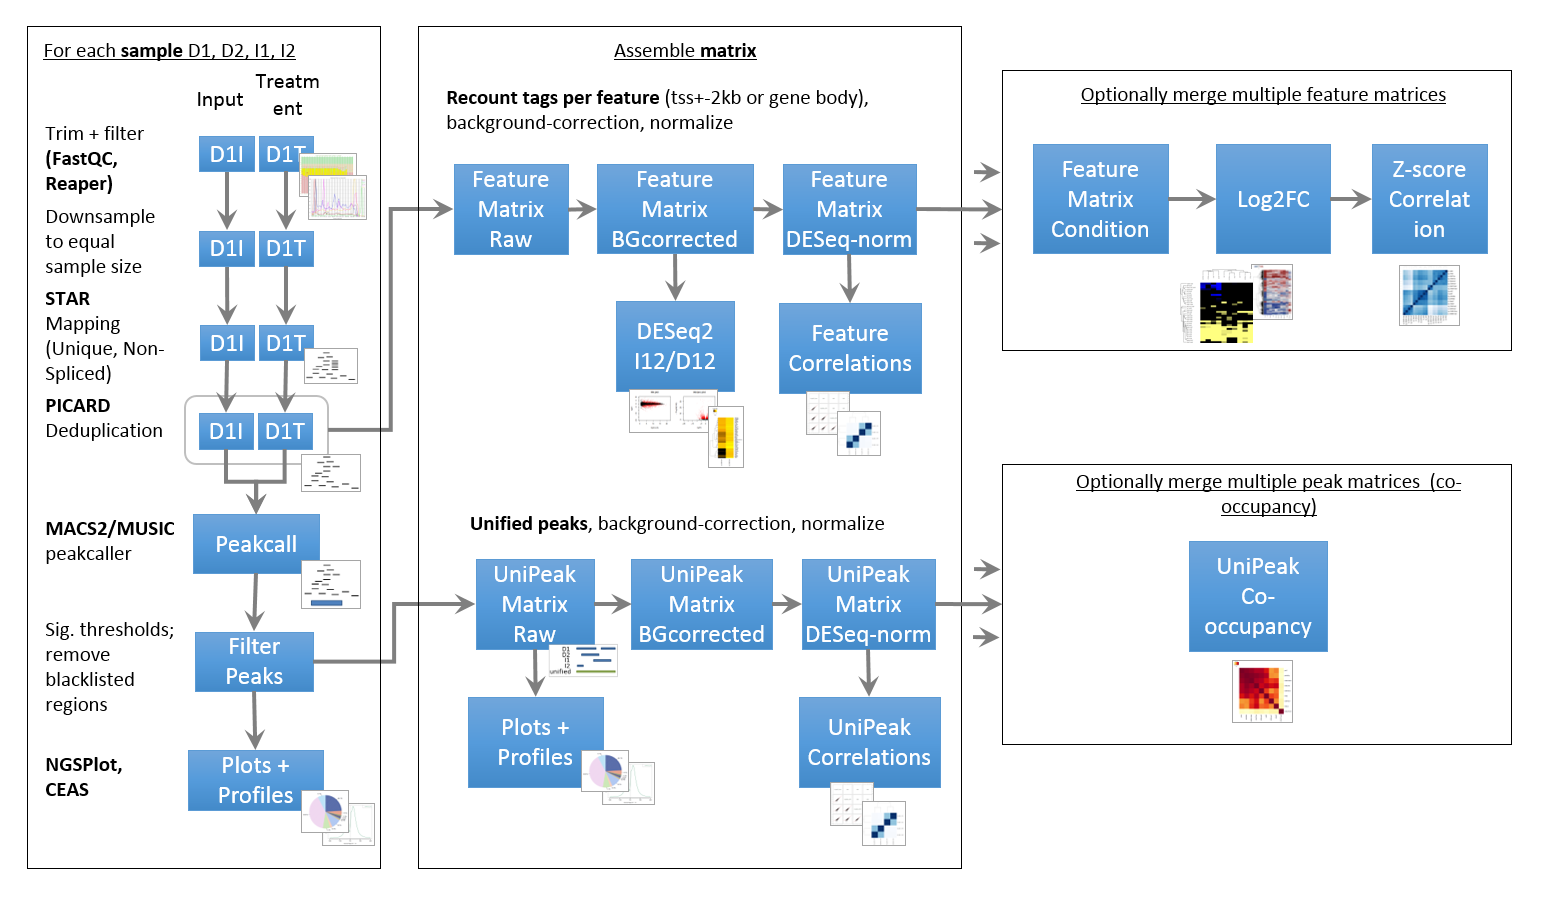
ChIP- and ATAC-Seq rely on highly similar pipelines that also have a lot in common with a typical RNA-Seq pipeline. One major difference is the peak calling, which has to effectively identify narrow (TF, ATAC) or very broad peaks (some histone marks). Furthermore, peaks have to be associated with a meaningful genomic feature (gene, enhancer, LTR, …) to permit further classification.
- Quality control (Contamination with other organisms, rRNA depletion, mtRNA depletion, removal of sequencing adapter/primer)
- Optimal mapping of non-spliced reads (multi-mapping, PCR duplicates)
- Reads resulting from histone modifications, transcription factors, and accessible chromatin assays need different filtering and peak calling algorithms
- Peaks deriving from replicate samples have to be merged and background/input samples have to be taken into account
- Incremental annotation vs. a variety of features (genes, promoters, enhancer, …)
- Production of abstract visualizations to assess data quality and depict results (PCA, GSEA, Locus plots, Venn/UpsetR)
- Assembly of tables/figures/methods into concise and user-friendly collections (Excel, Powerpoint)
Pipeline

Results
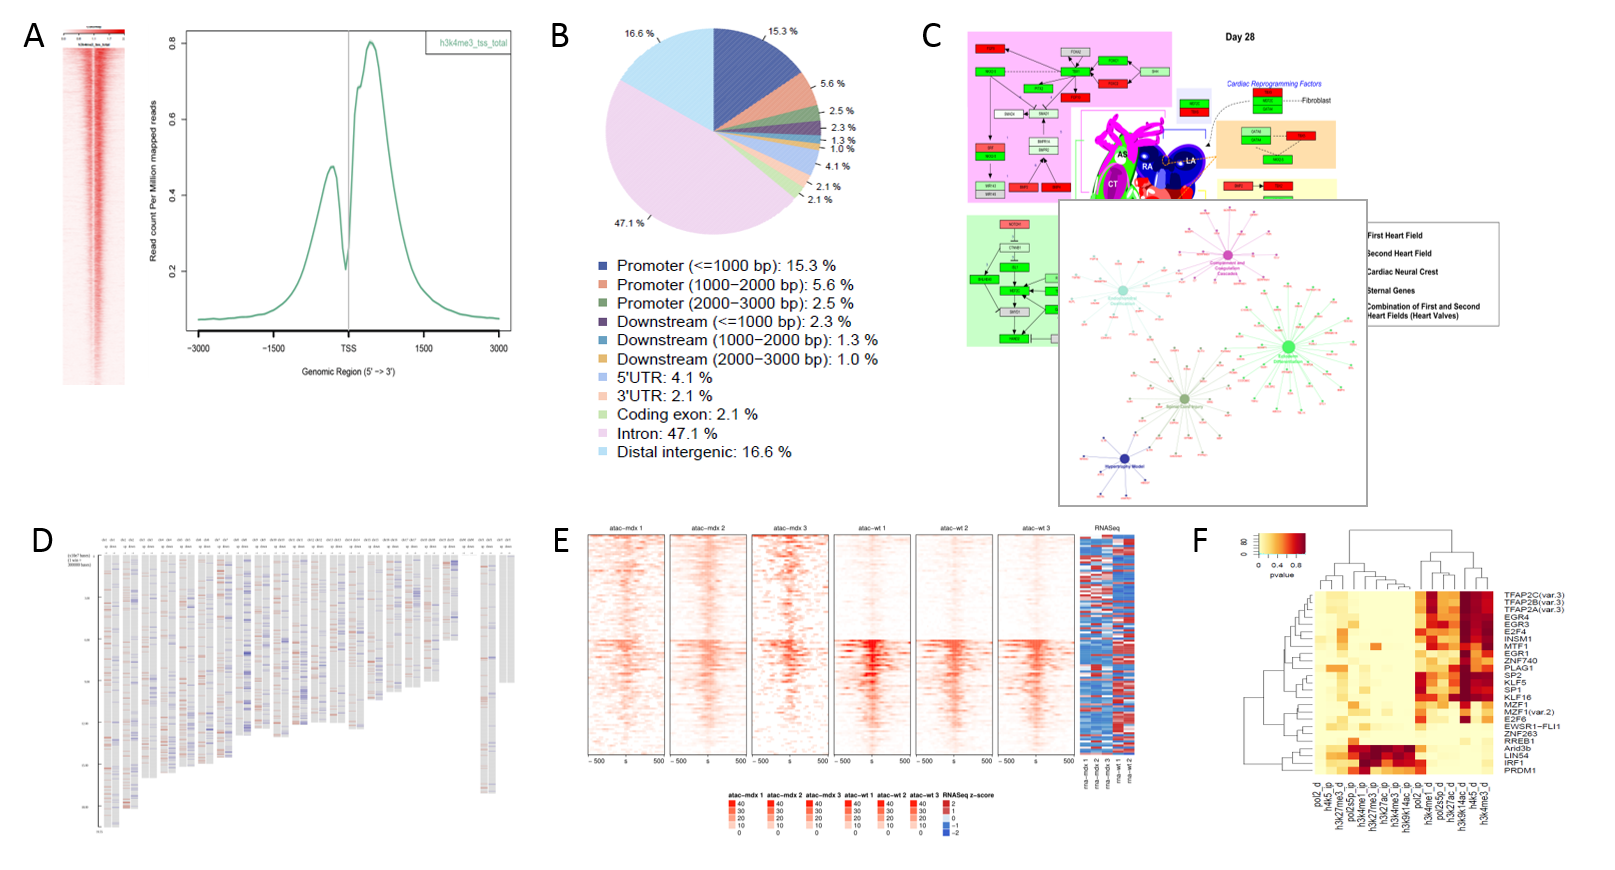
 Typical plots produced by the pipeline. A) Profile plots depicting aggregate coverage signal over selected genomic locations, B) General genomic distribution of peaks, C) Functional enrichment of known pathways and networks, D) Enrichment along chromosomes, E) Differential coverage of e.g. peaks, F) Enrichment of differential promoters for TF binding sites.