Our software

robust proportion analysis for single cell resolution data

Scanpro

Scanpro is a modular tool for proportion analysis, seamlessly integrating into widely accepted frameworks in the python environment. Scanpro is fast, accurate, support datasets without replicates, and is intended to be used by bioinformatics experts and beginners.

Main Features

  • Versatility for Replicated and Unreplicated Data

  • Seamless Integration into Python Ecosystems

  • Comprehensive Analysis and Visualization

  • Fast Performance and Robustness

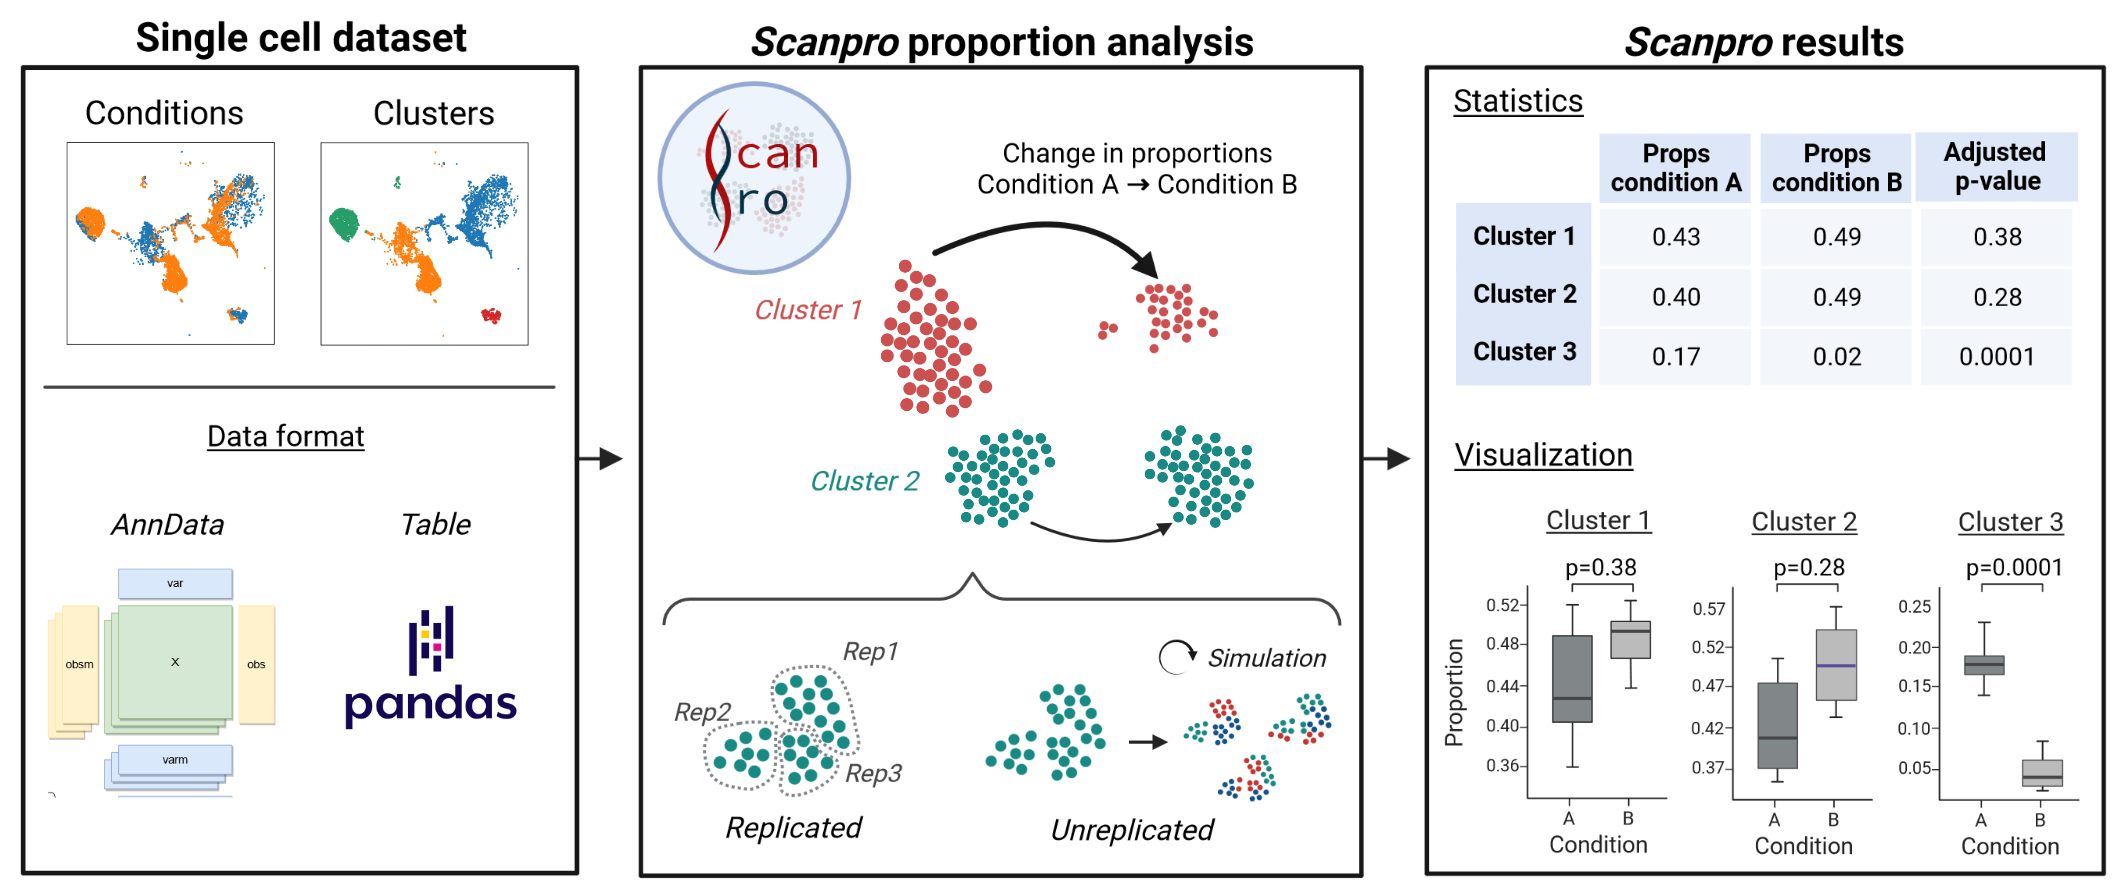
Scanpro can be run on the data using the widely accepted AnnData class object and thus integrated into the Scanpy (scRNAseq), Episcanpy (scATAC), and MUON (multiomics) ecosystems in Python. In addition, a table of cells with annotations in Pandas format is supported. During the analysis, Scanpro uses the number of cells within each condition to estimate whether the cells have different composition in either of the clusters. When the data is replicated, Scanpro applies a Python implementation of the empirical Bayes method presented in the propeller tool. However, when the data is unreplicated, Scanpro offers a robust method to simulate pseudo-replicates by splitting the original samples into multiple replicates using bootstrapping without replacement, which extends the usability of the tool to non-replicated datasets. While this method cannot replicate the biological variance of real replicates, the randomized bootstrapping explores the possibilities that the observed changes in cluster sizes arose by chance. In order to control for outliers of the randomized splitting, the pseudo-replication method is run 100 times and the median p-values for each cluster are calculated. After the analysis, Scanpro reports final statistics, as well as matrices for cell proportions, experimental design, and integrated plotting methods to visualize proportions. These visualizations include a box plot overview of samples (either original or simulated), which can be used to visually confirm differences in cell proportions per cluster. Moreover, Scanpro provides the possibility to restrict the analysis to certain conditions of interest, add covariates per sample as well as support multi-condition comparison using ANOVA. Scanpro is intended to be used at various levels of bioinformatic proficiency by providing exemplary jupyter notebooks and an extended manual within the public code repository

A framework to streamline single cell analysis

SC-Framework

The SC-Framework is comprised of a python package and a collection of jupyter notebooks to enable a concise and reproducible method to do single cell analysis.

The SC-Framework is a single cell analysis pipeline that allows for reproducible and streamlined analysis while retaining the flexibility that is needed to explore single cell datasets. It is comprised of a python package that provides a collection of functions supported by extensive documentation to work on single cell data. And jupyter notebooks that string these individual functions into an easy to follow and reproducible step-by-step analysis. The SC-Framework provides notebooks to do analysis on RNA as well as ATAC analysis, which are set up to automatically create folder structure populated by a varity of visualizations, tables and log-files among other things.

Improving quality control of single-cell ATAC-seq data

PeakQC

A novel algorithm based on a single wavelet transform like convolution to automate quality assessment for single-cell ATAC-seq data.

Assay for Transposase-Accessible Chromatin using sequencing (ATAC-seq) has emerged as a leading method for studying chromatin accessibility and is now widely used at the single cell level. High data quality is critical for reliable downstream analyses, especially in single-cell studies where sparsity and low signal-to-noise ratios can obscure biological insights. While well-established quality control protocols exist for bulk ATAC-seq, adapting them to single-cell data presents unique challenges due to the sheer number of cells. Key features of ATAC-seq, such as enrichment of specific regions and periodic patterns in fragment length distributions, are well-established quality indicators. However, fragment length distributions cannot be manually assessed at single cell resolution.

To address this, we developed PEAKQC, a novel algorithm based on a single wavelet transform like convolution to automate quality assessment for single-cell ATAC-seq data. By analysing fragment length distributions at the single-cell level, PEAKQC overcomes the limitations of manual inspection and provides an efficient and scalable solution. We were able to show that its features extend and improve existing quality control approaches, leading to better clustering results.

Nucleosome Positioning - NucleoDetective

NucleoDetective

NucleoDetective is a tool to predict nucleosome positions using ATAC-seq data and to compare the found patterns across different conditions.

Differential nucleosome positioning analysis unravels differences in nucleosome array configurations between biological conditions. Nucleosome positions can be determined based on fragmentation patterns created during the ATAC-seq assay. By evaluating fragment length distribution at each position and comparing it to a background, NucleoDetective (NDetect) is able to calculate a nucleosomal signal across peak regions in the genome and predict nucleosome positions based on it.
Furthermore, other metrics describing the predicted nucleosomes individually and in relation to one another are derived from the prediction. Afterwards, individual conditions are compared to each other and peaks with differential nucleosome patterns are identified. Peak intersecting Transcription Start Sites (TSS) are assessed in a separate downstream analysis.

Pipelines to process bulk high throughput sequencing data

Bulk Pipelines

Bulk RNA/ATAC/ChIP-Seq are analyzed via in-house software pipelines.

Bulk pipelines are based on mapping/counting reads at known features (e.g. genes) or at loci with significant enrichment (peaks). Typical steps include QC, differential expression analyses, annotation, clustering, and gene set enrichment analyses. Pipelines are heavily integrated with internal hard- and software resources and unfortunately not runnable externally.

Find single nucleotide polymorphisms for precise ORF disruption

WobbleDORF

WobbleDORF is an modular structured command line tool to find single nucleotide polymorphisms, that would disrupt an open reading frame. Main Feature is the frame specific preservation via wobble bases.

WobbleDORF is an modular structured command line tool to find single nucleotide polymorphisms, that would disrupt an open reading frame. Its designed to work with generic fasta and gtf files and can be used to pinpoint a specific transcript or a whole genome. Main Feature is the preservation of cannonical open reading frames and the usage of wobble bases to disrupt frame different open reading frames inside preserved ones. Furthermore multiple gRNA design tools are integrated, as well as different output formats for visualization.

Design and implementation of a tool to identify genetic directional dependencies

Genetic directional dependencies

Genetic directional dependencies

Prediction of combinatorial phenotypes in which the order of mutations direct the phenotype from CRISPR pertubation screens.

Single genes are rarely causative for complex cellular phenotypes. Instead, complex interactions of two or more genes individually contributing to a phenotype subsume their effects until a stage of phenotypic robustness (homeostasis) is achieved. These interactions can occur by additive effects triggered by the perturbation of multiple genes. In this context, genetic interactions (GI) are defined as a combination of two or more genes whose contribution to a phenotype cannot be explained by either gene’s single effect. Within GIs, genetic directional dependencies make up a subclass of interactions. In this context, the term directionality refers to combinatorial phenotypes in which the order of mutations directs the phenotype.

In order to screen for directional interaction on a larger scale, we used the recently introduced 3C CRISPR/Cas technology to perform a time dependent inactivation screen of gene pairs. We created a library for cancer druggable gene pairs and conducted a time dependent (14 and 28 days) NGS experiment. To computationally infer directionals from the experimental data, we propose a pipeline including a learning capable algorithm. The pipeline performs i) quality control steps, ii) replicate handling if applicable, iii) normalization and iv) scoring of the directional potential per gene pair. Our algorithm calculates and considers characteristics including positional effects, dual-edit over anchor phenotype, the single gene effects (main effects), and a gene’s essentiality.

A R based package for gRNA design

multicrispr²

multicrispr² is a R based pacakge for designing gRNAs with the special feature of designing gRNA pairs intended for genomic excision.

The Crispr-Cas technology is widely used and became a standard procedure for genome editing. A more recent idea for utilizing the Crispr-Cas technology is to excise genomic regions by pairing two gRNAs around the region to be excised. multicrispr² provids the functionallty for a fast gRNA and especially a gRNA pair design. The design is kept simple but reliable to be able to design a variety of gRNA(s) (pairs) rapidly. To furhter increase runtime of the gRNA pair design, gRNAs are designed by recusivly increasing the target range around each given excision feature. If enough gRNAs are found to build the required amount of pairs for a target multicrispr² does not continue to design gRNAs for this specific target.

multicrispr² applies a number of filters on the gRNAs, some of which are filtering on off-targets, on-target score and GC content. The goal is to get a library ready list of gRNAs without further desining work required.

A complete framework for performing TF co-occurence and TF grammar analysis

TF-COMB

TF-COMB (Transcription Factor Co-Occurrence using Market Basket analysis) is a framework of methods for investigating transcription factor co-occurrence and and grammar of TF binding.

Introduction

In many cases, combinations of multiple TFs are needed to elicit a specific cellular response - a concept known as TF co-occurrence. In order to detect co-occurring TF binding sites, we developed TF-COMB (Transcription Factor Co-Occurrence using Market Basket analysis), which utilizes a flexible input of ChIP-seq peaks, motif positions, footprint locations, ATAC-seq peaks etc. to identify highly co-occurring TFs/regions. The association is calculated using an association method known as a market basket analysis. Market basket analysis has classically been applied to investigate shopping habits such as “if the customer buys cereal, they are likely to buy milk”, however, this approach can be applied to TF co-occurrence analysis like “if TF1 binds, it is also likely that TF2 binds” as well. This co-occurrence analysis is extended in the context of binding grammar, which is defined by the need for a syntax of TFBS binding, such as a certain arrangement, order, distance, affinity and/or relative orientation of the given TFBS.

overview of TF-COMB functionalities

Main features

The main features of TF-COMB are:

  • Easy to use
  • Global TF co-occurrence analysis
  • Preferred distance between TFs
  • Orientation specificity of stranded regions
  • Differential co-occurrence between conditions
  • Network analysis and visualization to identify protein hubs

TF-COMB can be used as a framework as illustrated below:

Design and implementation of a tool to manage experimental metadata

FRED

FRED (FaiR Experimental Design) is a program to generate, edit and search metadata in a predefined structure.

Main features

  • File-based dynamic and hierarchical structure for metadata storage
  • Generation of metadata files according to the structure
  • Search for experiments based on metadata

FRED provides the user with a flexible design for a machine-readable metadata format that conforms to the FAIR principles (Findable, Accessible, Interoperable, Reusable) and enables the storage of data containing any omics technology. FRED as a toolbox includes a dialog-based function for creating metadata files as well as a structured semantic validation and logical metadata search. Furthermore, FRED offers an interface for external calls, e.g. via a web frontend. The tool requires little IT effort and is intended to be used by non-computer scientists as well as by specialized institutions.

A pipeline for generation of novel transcription factor motifs

DENIS

DENIS (DE Novo motIf diScovery pipeline) is a pipeline constructing binding motifs for unknown transcription factors from ATAC-seq data.

Transcription factors (TFs) are crucial epigenetic regulators, which enable cells to dynamically adjust gene expression in response to environmental signals. Computational procedures like digital genomic footprinting on chromatin accessibility assays such as ATACseq can be used to identify bound TFs in a genome-wide scale. This method utilizes short regions of low accessibility signals due to steric hindrance of DNA bound proteins, called footprints (FPs), which are combined with motif databases for TF identification. However, while over 1600 TFs have been described in the human genome, only ~ 700 of these have a known binding motif. Thus, a substantial number of FPs without overlap to a known DNA motif are normally discarded from FP analysis. In addition, the FP method is restricted to organisms with a substantial number of known TF motifs. Here we present DENIS (DE Novo motIf diScovery), a framework to generate and systematically investigate the potential of de novo TF motif discovery from FPs. DENIS includes functionality (1) to isolate FPs without binding motifs, (2) to perform de novo motif generation and (3) to characterize novel motifs.

A complete framework for performing footprinting analysis on ATAC-seq data

TOBIAS

TOBIAS (Transcription factor Occupancy prediction By Investigation of ATAC-seq Signal) is a framework of tools for investigating transcription factor binding from ATAC-seq signal.

Main features

  • All in one digital genomic footprinting framework
  • Easy to use
  • Powerfull downstream analysis modules
  • Universal file formats

ATAC-seq (Assay for Transposase-Accessible Chromatin using high-throughput sequencing) is a sequencing assay for investigating genome-wide chromatin accessibility. The assay applies a Tn5 Transposase to insert sequencing adapters into accessible chromatin, enabling mapping of regulatory regions across the genome. Additionally, the local distribution of Tn5 insertions contains information about transcription factor binding due to the visible depletion of insertions around sites bound by protein - known as footprints.

TOBIAS integrates these footprints with genomic information and transcription factor motifs to predict transcription factor binding. TOBIAS is collection of command tools written in Python, with each tool is intended to be used in a framework approach as illustrated below:

MAnaging Computing SErvices on Kubernetes

MACSEK

MACSEK(MAnaging Computing SErvices on Kubernetes) is a framework that provides a computing service on Kubernetes cluster, such as provided by deNBi. It creates a service on the clusters, which allows the upload of files for all kinds of calculation, manages resource allocation on the cluster and provides the download of the results.

Features

  • Combine computing resources of a cluster with individual software/pipeline
  • Manages the file transfer on the user side
  • Automatated deployment of the service on the cluster
  • Manage the calculation on the cluster

MACSEK Overview

The MACSEK service is realized by two deployments, namely a NGINX server, which manages file services, and a software specific deployment that starts the pipelines with the respective data. The NINGX has two accessible URL paths, one for uploading data for processing, and the second one for downloading the generated result files. While the upload path is unrestricted, the download path is restricted to individual workloads. To communicate with the service from a locally running pipeline, MACSEK provides a Python script that can be integrated into e.g. Nextflow at a certain step. As proof of principle, we set up a nextflow pipeline for the TOBIS tool. For this example, the pipeline receives BED and BigWig formated files as input for calculation. In order to speed up the upload, the files are automatically packed into a tar-archive. In addition to the files, a configuration file is created, including an automatically generated password and a user ID for subsequent download of results. Both are md5 hashed before uploaded. In addition to the access data, a unique ID for the calculation is generated, enabling the pipeline to map results back to the calling user. Result files are packed as well and reslut transfer back to the enduser is done via the NGINX gain.

The 3 parts of MACSEK: The automatic deployment of the service by the administrator, the automatated file transfer from/to the users and the calculation on the cluster.

MACSEK details

In order to manage file transfers, apllication virtualisation and the multiple user/process environment on the cluster as a service, MACSEK utilizes an NGINX serverice for webbased user data interactions and various types of volumens within the Kubernetes cluster. In the TOBIAS example, the NGINX receives the input files from a local user TOBIAS pipeline and forwards them to a persistent volume on the cluster. The TOBIAS deployment constantly monitors this volume for new incoming workloads. Once the NGINX stores a new input file, a thread is triggered that immediately starts processing the input. After unpacking the supplied configuration file is used to generate a directory on the cluster into which the uploaded files are moved. In addition, the authentication data generated during the pipeline call is used to generate an account on the NGINX for the subsequent result download. Next, a configuration file for the pipeline is automatically built to start the calculation. Once the pipeline is started, the workload is optimized to utilize all assigned computing resource of the cluster. Therefor the individual processes are started as independent pods, including application containers. When the calculation is finished, results are aggreated and finally transfered to the previously created directory under the given ID. A path for the download is then built with according to the assigned ID as well. While the calculation runs on Kubernetes, the MACSEK module, which runs locally at the user client, checks whether the result files are available for download. Once calculation is finished and results are downloaded, the results are unpacked and subsequently provided for further steps that might run locally on the client. Finally, the MACSEK module sends the user ID to the cluster as a signal to have finalized the download. Triggered by this signal, the cluster terminates all files and folders connected to the finished workload.

Iterative & Interactive dashboards

i2dash

Scientific communication and data visualization are important aspects to illustrate complex concepts and results from data analyses. The R package i2dash provides functionality to create customized, web-based dashboards for data presentation, exploration and sharing. i2dash integrates easily into existing data analysis pipelines and can organize scientific findings thematically across different pages and layouts.

Main features

  • Easy integration into existing analysis pipelines in R
  • Support for multiple components, such as htmlwidgets, tabular data, text, images etc.
  • Creation of web-based, sharable, static or interactive dashboards
  • Enables a flexible and iterative cycle of dashboard development

A customized dashboards can be integrated into an existing data analysis pipelines in R (left). After initialization, pages containing components with customized content can be added step-by-step to the dashboard at any stage of the data analysis. The final dashboard is assembled into an R markdown file, and shared together with RDS data files for further use within RStudio, or can also be deployed on a R Shiny Server or as stand-alone HTML file.

i2dash for single-cell RNA-seq data analysis

Recent development of single-cell technologies enables the molcular investigation of thousands of individual cells in a single experiment. Single-cell applications are available for e.g. transcriptomes or chromatin accessibility of individual cells. Respective analysis workflows allow for the identification of cellular sub-populations, gene regulatory networks and dynamic cellular trajectories. In order to improve reporting on SC applications, we extended i2dash to enable users to create dashboards with a focus on visualization and exploration of data from single-cell RNA-seq.

Features

  • Visualization of dimension reductions and cell clusterings
  • Dynamic exploration of single-cell gene expression, cell and feature metadata
  • Interactive presentation of tabular data, e.g. from differential expression analysis
  • Pre-defined pages enable non-expert users to explore different aspects of their scRNA-seq data
  • A large collection of linkable components enable expert users to create fully customized dashboards

MAnaging Multiple Projects On Kubernetes

MaMPOK

MaMPOK is an offline Kubernetes management tool. It is intented to use Kubernetes cloud computing at de.NBi. It provides methods to deploy e.g. web apps as containers automatically. It automates file transfers via a S3 object storage, takes care of container images, and keep track of a large number of projects.

Main features

  • Local kubernetes cluster management tool
  • Support the management of multi- project/omics/webApps environments
  • Adds a higher level of container organisation
  • Automation of cluster deployment processes, if needed directly attached to analysis pipelines

MaMPOK data organization

MaMPOK’s functionality is based on a local folder structure containing the projects intented for management (e.g. RNAseq projects and WiLSON as webApp). Files required for each project as well as a project JSON files, optionally derived from an analysis pipeline, classify the project and what webservices has to be provided. This JSON file, called MaMPlan (MaMPOK-project-plan) holds information about the project name, the necessary files and the tool/container to be used as web application. Needed information can be divided into single JSON files, called or derived from MaMplates (MaMPOK-templates). From this locally stored information, MaMPOK creates all necessary Kubernetes objects to provide a online web application.

Managing webApps via MaMPOK

MaMPOK is intended to keep track of multiple webApps linked to locally stored projects on a Kubernetes cluster. The typical environment is a large scale bioinformatics facility dealing with multiple types of omics data and large cluster environments. It provides a set of functions that are crucial to manage numerous Apps. For instance, it allows to list all projects having a distinct webApp on the cluster, to re-deploy or to renew individual deployments for e.g. applications (e.g. WiLSON), type of projects (e.g. RNAseq) or container image versions.

The tool for MS metadata

MARMoSET

Extracting Mass Spectrometry Metadata from RAW Files is laborious and needs a lot of manual interaction. MARMoSET is intended to automate and arange metadata for various reporting- and journal standards.

Main features

  • Automated metadata extraction from small and large sets of MS raw data
  • Reduction metadata into groups of shared parameter sets
  • Tabular representation for quality control, reporting and publication

MARMoSET: Extracting Publication-ready Mass Spectrometry Metadata from RAW Files

In the context of mass spectrometry, metadata describing the instrument settings are of central importance. Hundreds of data acquisitions might be linked to a single experiment in proprietary file formats. TIn the light of different reporting standards, this frequently leads to manual metadata extraction and formatting. In order to improve data reporting, our MARMoSET tool is intended to automatically extracts and reduces publication relevant metadata from Thermo Fischer Scientific RAW files.

Visualization of omics data

WIlsON

High-throughput (HT) studies of complex biological systems generate a massive amount of omics data. The results are typically summarized using spreadsheet like file formats. Visualization of this data is a key aspect of both, the analysis and the understanding of biological systems under investigation. While users have many visualization methods and tools to choose from, the challenge is to properly handle these tools and create clear, meaningful, and integrated visualizations based on pre-processed datasets.

Main features

  • Visualization for all kinds of omics data
  • Easy to setup R shiny app
  • Shiny modules allow to generate individual visualization frameworks
  • Universal file format

I’m a demo server

WIlsON: Webbased Interactive Omics visualizatioN

The WIlsON R package employs the R Shiny and Plotly web-based frameworks using a client-server based approach comprising a range of interface and plotting modules. These can be joined to allow a user to select a meaningful combination of parameters for the creation of various plot types (e.g. bar, box, line, scatter, heat). The modular setup of elements assures a concise code base and simplifies maintenance. An app thus created can be mounted on an R Shiny Server or inside R Studio. Data must be supplied server-side using a custom tab-delimited format derived from the SummarizedExperiment format (Clarion) and can principally originate from any analysis (e.g. RNA-Seq, ChIP-Seq, Mass Spectrometry, Microarray) that results in numeric data (e.g. count, score, log2foldchange, zscore, pvalue) attributed to a feature (e.g. gene, transcript, probe, protein).

a tool for Universal RObust Peak Annotation

UROPA

UROPA (Universal RObust Peak Annotator) is a command line based tool, intended for universal genomic range annotation. Based on a configuration file, different target features can be prioritized with multiple integrated queries. These can be sensitive for feature type, distance, strand specificity, feature attributes (e.g. protein_coding) or anchor position relative to the feature.

Main features

  • Annotation of genomic loci
  • Flexible annotation rules
  • Generic tool configuration
  • Various output formats and result visualizations

The annotation of genomic ranges of interest represents a recurring task for bioinformatics analyses. These ranges can originate from various sources, including peaks called for transcription factor binding sites (TFBS) or histone modification ChIP-seq experiments, chromatin structure and accessibility experiments (such as ATAC-seq), but also from other types of predictions that result in genomic ranges. While peak annotation primarily driven by ChiP-seq was extensively explored, many approaches remain simplistic (“most closely located TSS”), rely on fixed pre-built references, or require complex scripting tasks on behalf of the user. An adaptable, fast, and universal tool, capable to annotate genomic ranges in the respective biological context is critically missing. UROPA (Universal RObust Peak Annotator) is a command line based tool, intended for universal genomic range annotation. Based on a configuration file, different target features can be prioritized with multiple integrated queries. These can be sensitive for feature type, distance, strand specificity, feature attributes (e.g. protein_coding) or anchor position relative to the feature. UROPA can incorporate reference annotation files (GTF) from different sources (Gencode, Ensembl, RefSeq), as well as custom reference annotation files. Statistics and plots transparently summarize the annotation process. UROPA is implemented in Python and R.

Analysis and visualization of differential methylation in genomic regions

ADMIRE

DNA methylation at cytosine nucleotides constitutes epigenetic gene regulation impacting cellular development and the stage of a disease. Besides whole genome bisulfit sequencing, Illumina HumanMethylationEPIC Assays represent a versatile and cost-effective tool to investigate changes of methylation patterns at CpG sites. ADMIRE is a semi-automatic analysis pipeline and visualization tool for Infinium HumanMethylation450K and Infinium MethylationEpic assays.

Features

  • Automatic filtering and normalization
  • Statistical testing and multiple testing correction
  • Supports arbitrary number of samples and sample groups
  • Differential methylation analysis on pre-calculated and individual genomic regions
  • Provides ready-to-plug-in files for genome browsers (like IGV)
  • Provides publication-ready figures for the most differentially methylated regions
  • Performs gene set enrichment analysis on predefined and individual gene sets