RNA-Seq
Gene Expression
Challenges
High-throughput RNA-Seq analysis of the cellular transcriptome has become largely standardized over the years. Nonetheless, many options exist to deal with various steps and issues along the way, that can have a dramatic impact on the interpretation and reliability of the results.
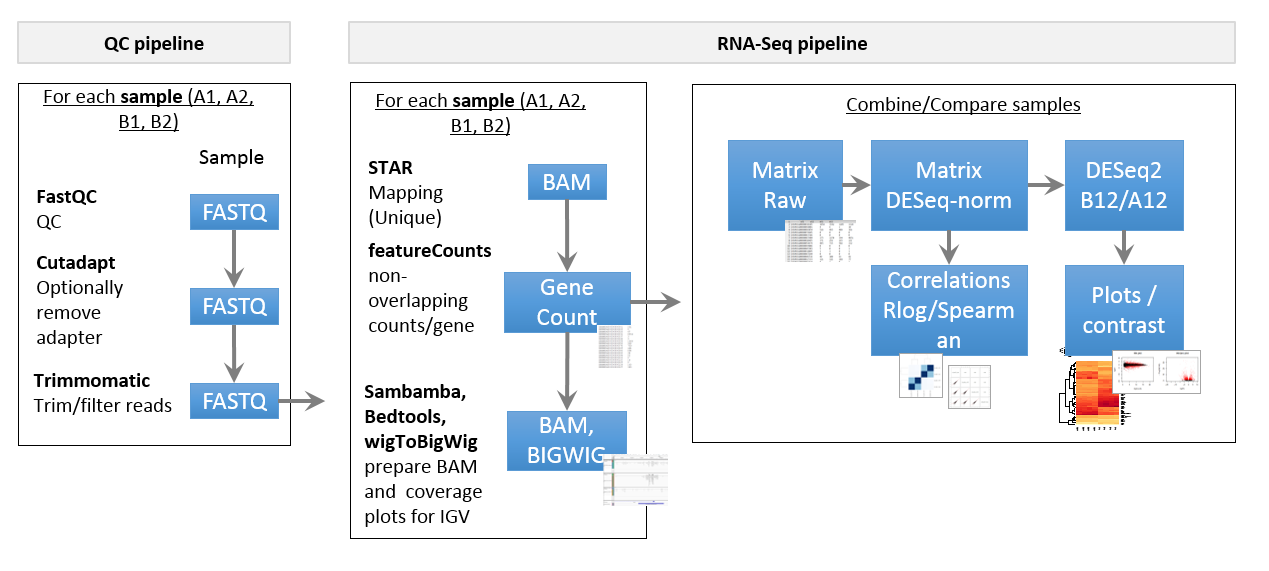
- Quality control (Contamination with other organisms, rRNA depletion, mtRNA depletion, removal of sequencing adapter/primer)
- Optimal mapping of spliced reads (multi-mapping, PCR duplicates)
- Optional batch correction (count matrix, contrast)
- Incremental annotation including multiple databases (Ensembl/Gencode, UniProt, Pathways/Ontologies)
- Production of abstract visualizations to assess data quality and depict results (PCA, GSEA, Locus plots, Venn/UpsetR)
- Assembly of tables/figures/methods into concise and user-friendly collections (Excel, Powerpoint)
Pipeline
Results
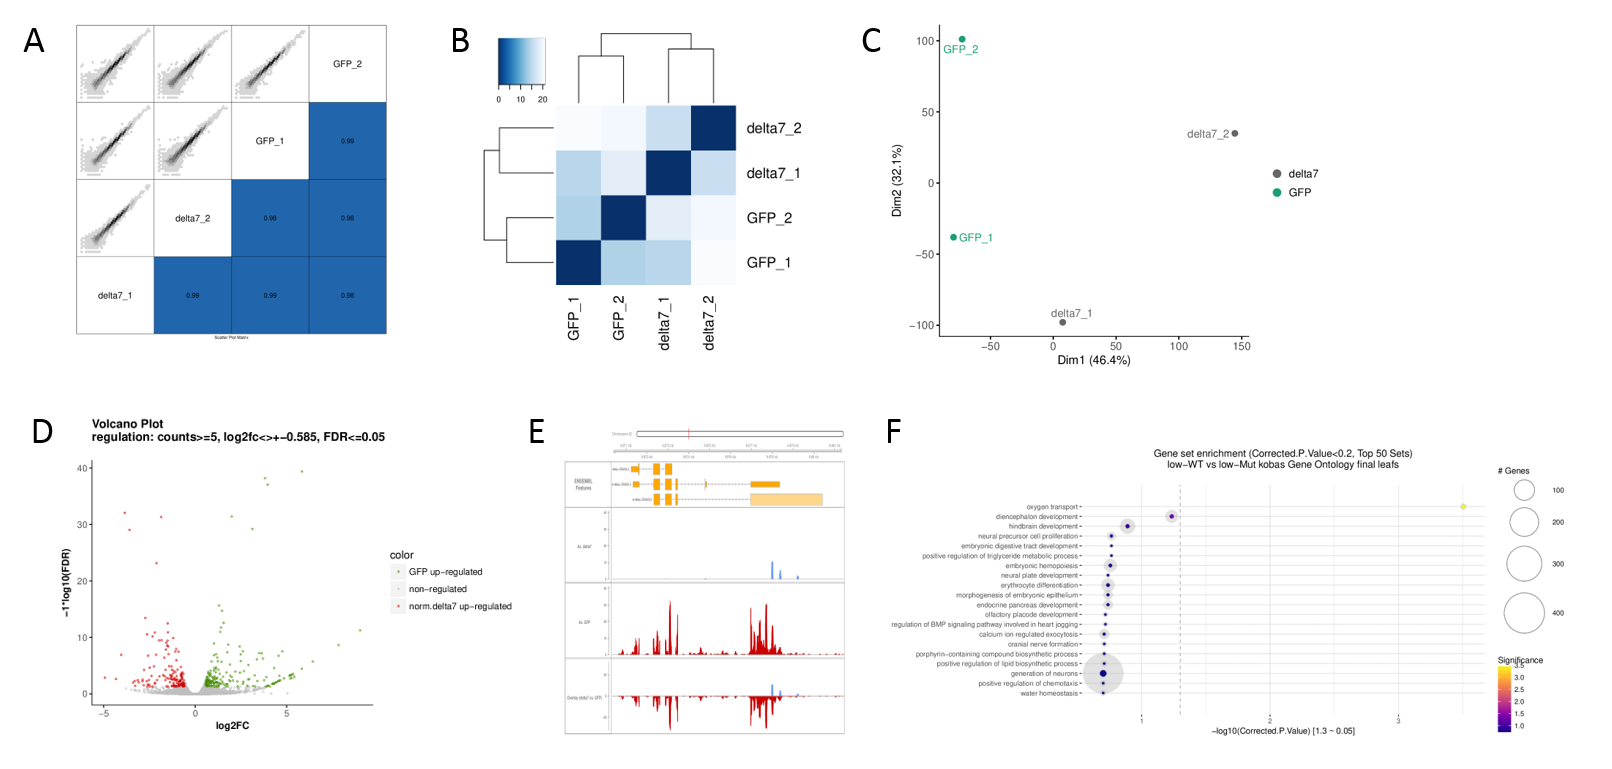 Typical plots produced by the pipeline. A) Scatterplot of all expressed gene counts including spearman correlation, B) Hierarchical clustering of all rlog-transformed gene counts per sample, C) PCA, D) Volcano plot for each contrast, E) Coverage of differentially expressed genes, F) Gene set enrichment analyses.