Iterative & Interactive dashboards
i2dash
Main features
- Easy integration into existing analysis pipelines in R
- Support for multiple components, such as htmlwidgets, tabular data, text, images etc.
- Creation of web-based, sharable, static or interactive dashboards
- Enables a flexible and iterative cycle of dashboard development
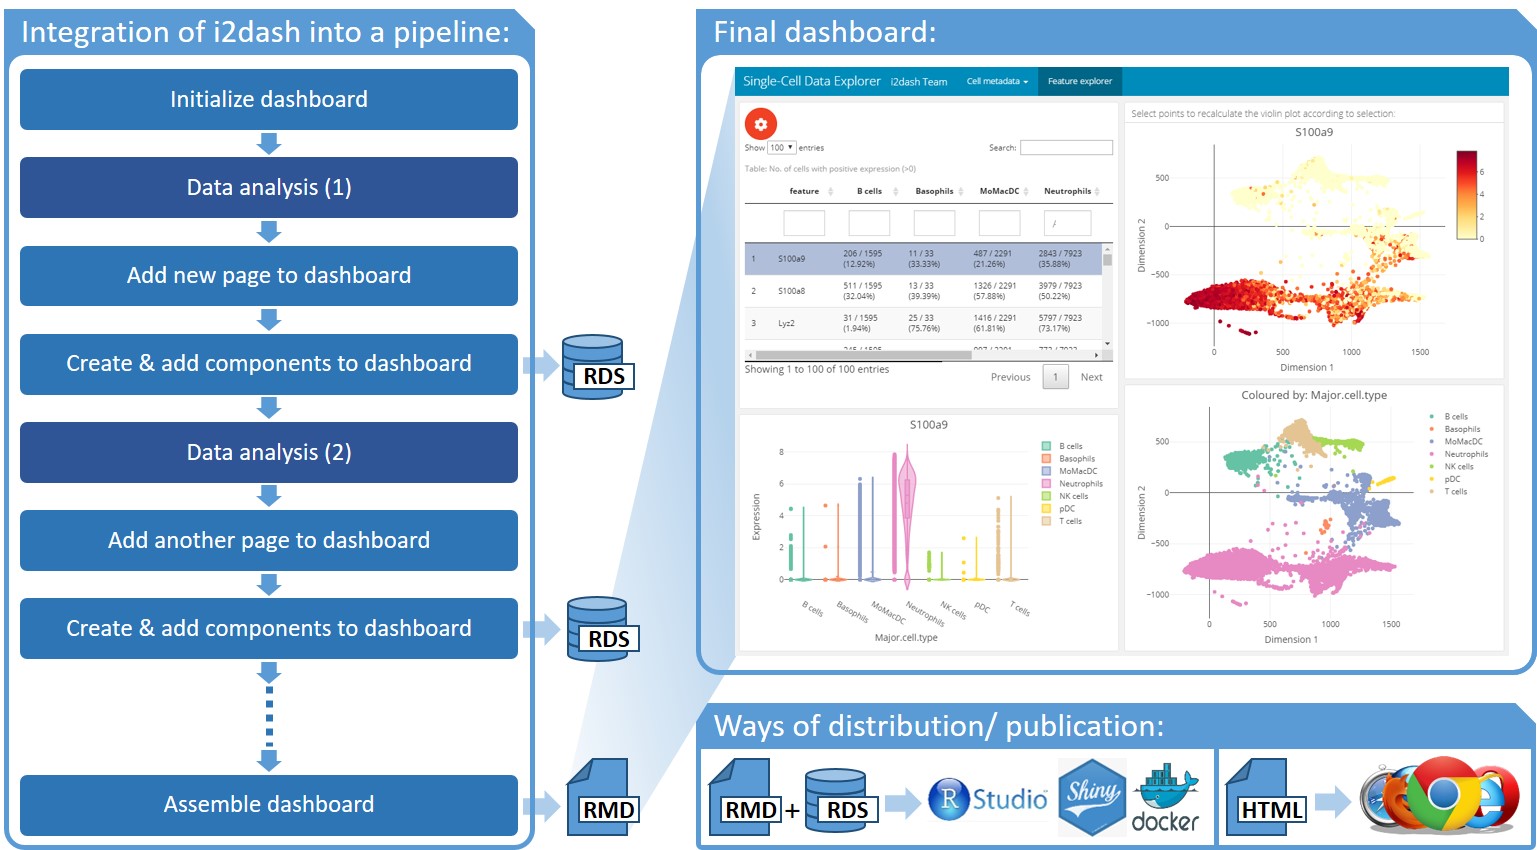
A customized dashboards can be integrated into an existing data analysis pipelines in R (left). After initialization, pages containing components with customized content can be added step-by-step to the dashboard at any stage of the data analysis. The final dashboard is assembled into an R markdown file, and shared together with RDS data files for further use within RStudio, or can also be deployed on a R Shiny Server or as stand-alone HTML file.
i2dash for single-cell RNA-seq data analysis
Recent development of single-cell technologies enables the molcular investigation of thousands of individual cells in a single experiment. Single-cell applications are available for e.g. transcriptomes or chromatin accessibility of individual cells. Respective analysis workflows allow for the identification of cellular sub-populations, gene regulatory networks and dynamic cellular trajectories. In order to improve reporting on SC applications, we extended i2dash to enable users to create dashboards with a focus on visualization and exploration of data from single-cell RNA-seq.
Features
- Visualization of dimension reductions and cell clusterings
- Dynamic exploration of single-cell gene expression, cell and feature metadata
- Interactive presentation of tabular data, e.g. from differential expression analysis
- Pre-defined pages enable non-expert users to explore different aspects of their scRNA-seq data
- A large collection of linkable components enable expert users to create fully customized dashboards