Home
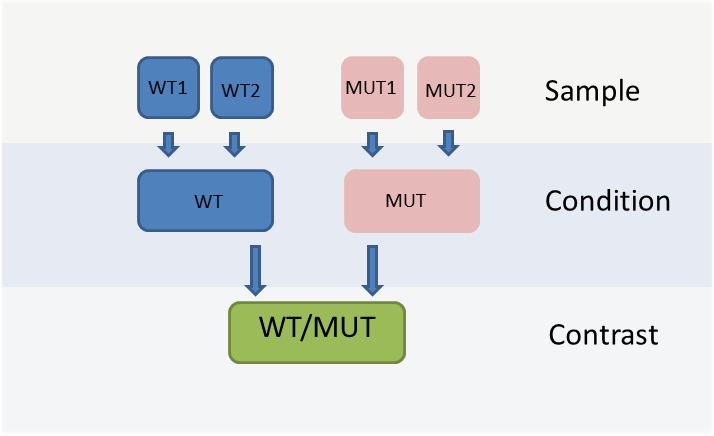
The WIlsON app is intended to interpret all types of quantitative data (e.g. multi-omics) which can be broken down to a key feature (such as genes or proteins) and assigned text columns and/or numeric values. It is designed to support common experimental designs by making use of individual data levels resulting from primary analysis, shown in the figure below.
The app provides a web-based analysis and visualization solution, realizing the basic idea to offer a flexible tool to the user without codifying any fixed or precalculated plots. This unavoidably leads to a certain degree of complexity. (And, the user should know what he/she wants to see:-) )
Once the experimental data is loaded into the app, the user can generate various plots following four basic steps:
- Filter for features of interest based on categorical (annotation) or numerical values (e.g. transcripts, genes, proteins, probes)
- Select plot type
- Adjust plot parameters
- Render/download result