WIlsON modules:Data reduction
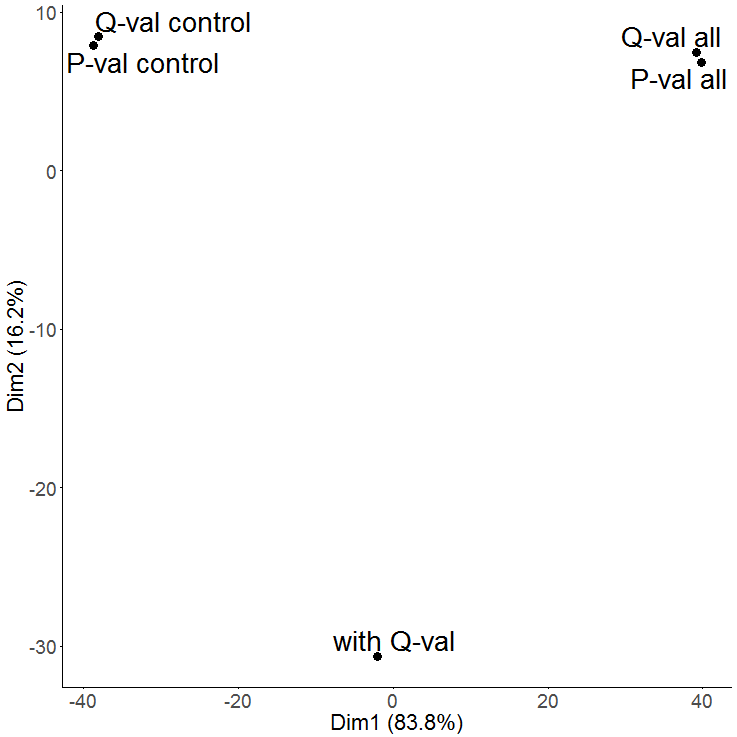
A PCA is used to get an overview on the variation of the data based on the selected features. By default the two dimensions with the highest variation are selected (PC1 and PC2) and presented in a two-dimensional scatterplot
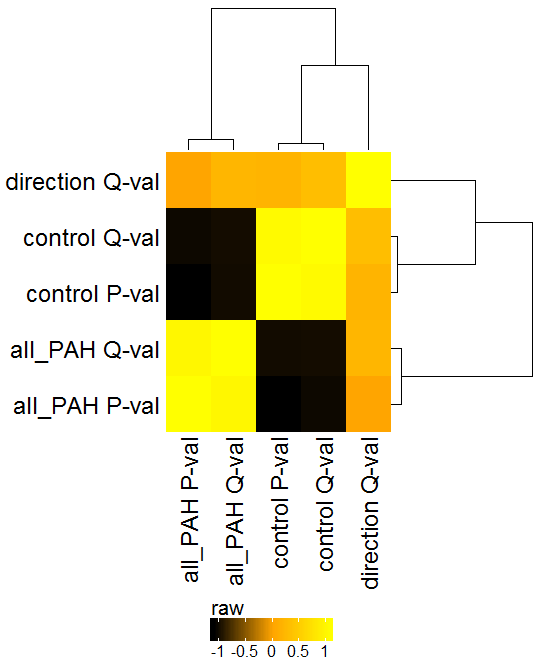
Similar to the PCA, this plot will show the global clustering of samples or conditions based on the selected features. A distance matrix is created using one of various options (e.g. euclidean, pearson, spearman, etc.) and visualized by a heatmap.