WIlsON modules:Scatterplot
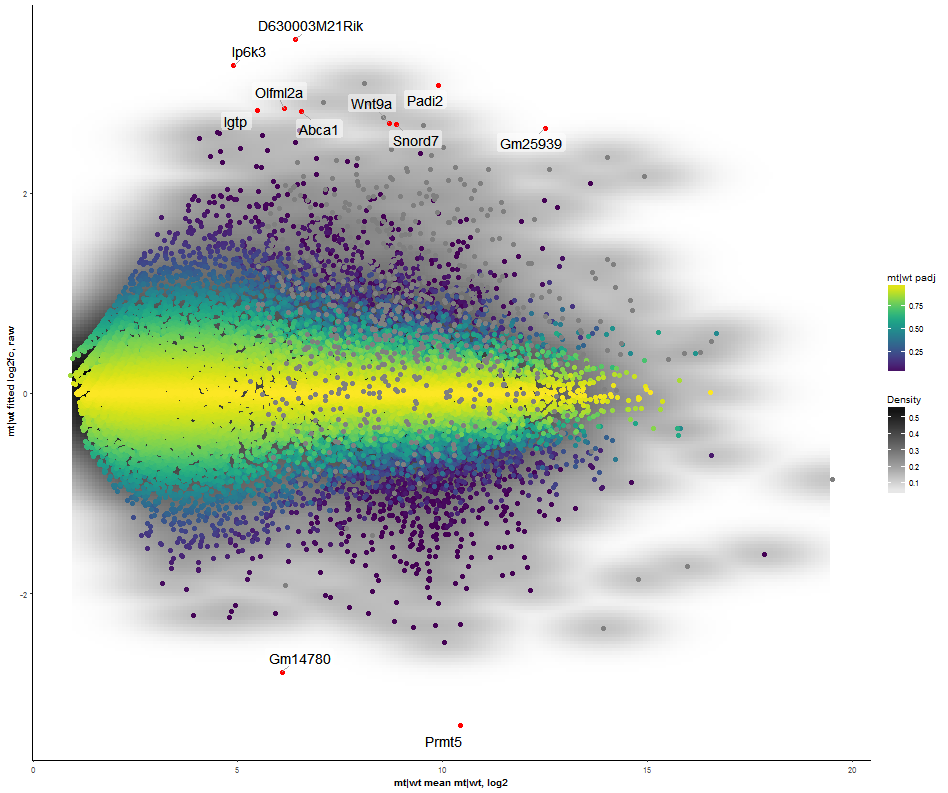
This plot illustrates the dependency of two (X/Y axes) or three (X/Y/color) attributes. It supports a density estimation (kernel smoothing) and trend lines. The axes to be displayed can be chosen among the numeric columns to e.g. create Volcano, MA, or other kinds of scatter plots. The scatterplot supports highlighting of a subset of data (feature selection, pane highlight).