WIlsON modules:Feature selection
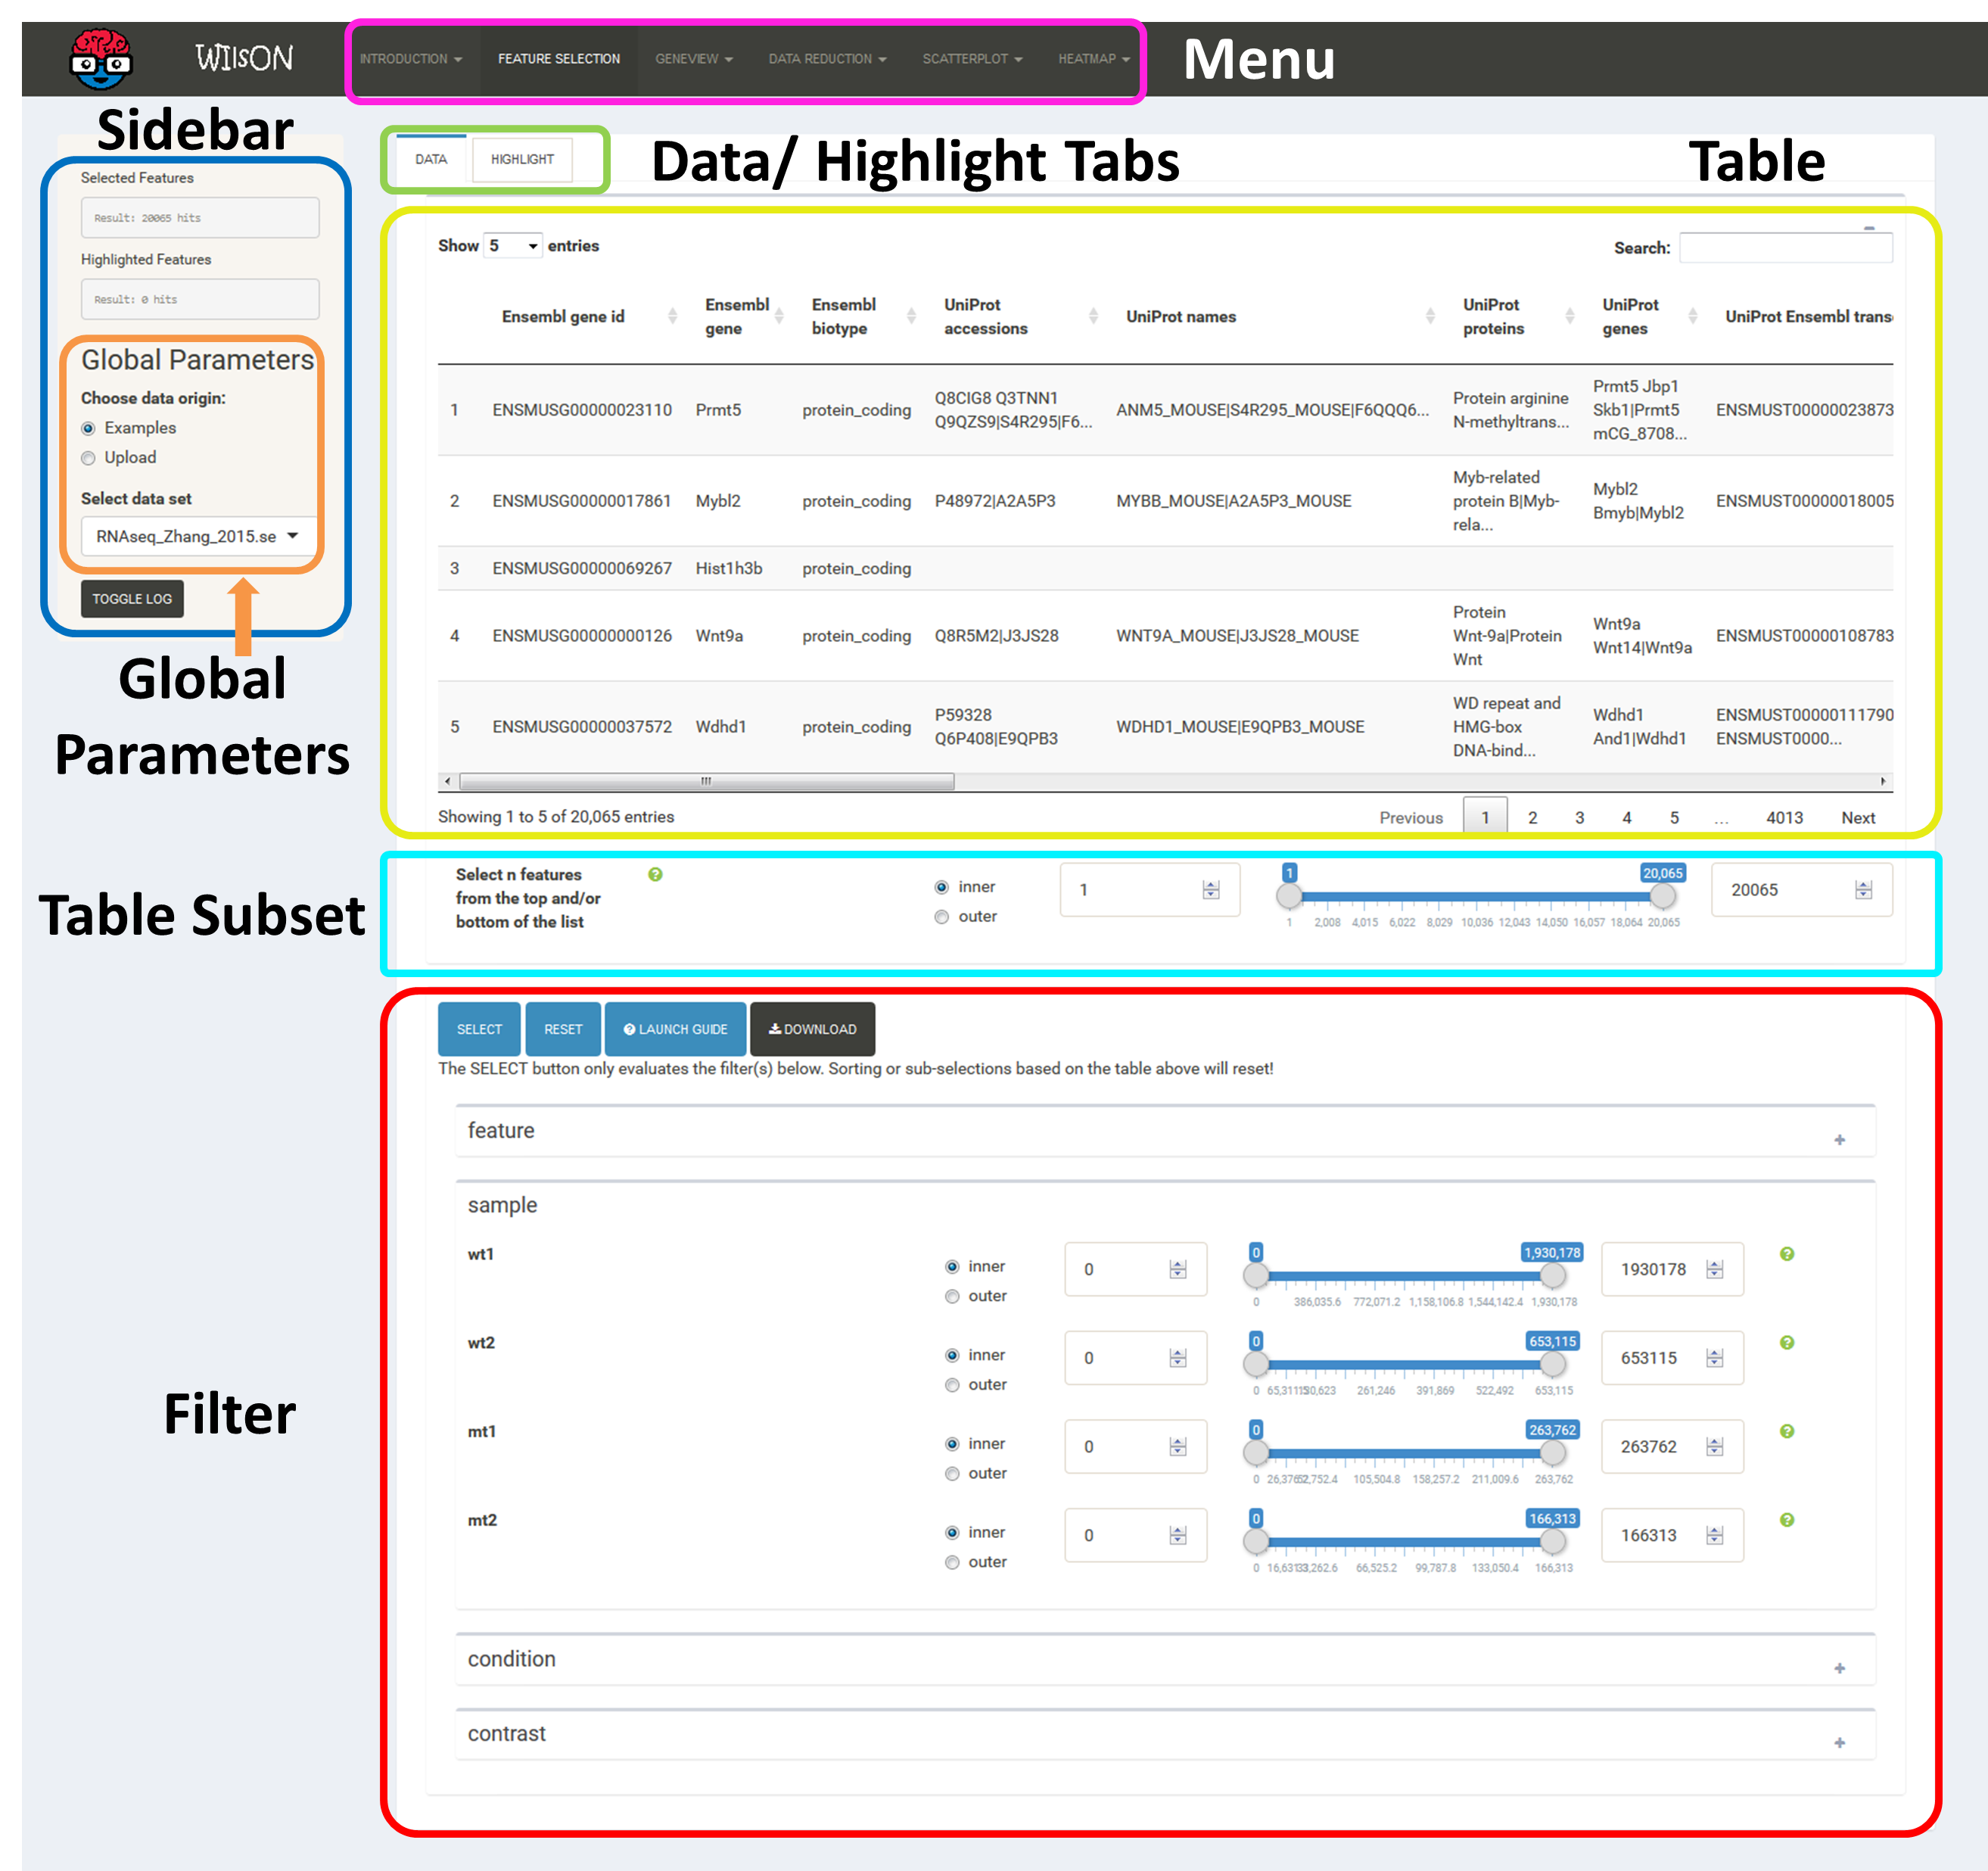
As mentioned above, the first step of using WIlsON after selection of the dataset of interest is to go to the tab "Feature Selection" in the top menu, where a subset of data to be used for plotting can be chosen. This is controlled by the additive application of filtering steps based on all data levels (sample/condition/contrast/feature) as defined in the input file. Prior to filtering, all data entries are shown, after adjusting filters just press the select button. If no filtering is desired, just press the "Select" button as well. If filtering is applied to the data columns, multiple entries (where possible) within one filter column are interpreted via logical OR operation, while multiple column filters are combined by logical AND operation.
After filtering, plots of interest can be selected and generated via the tabs on top. For most types of plots, a static version as well as an interactive version is provided.
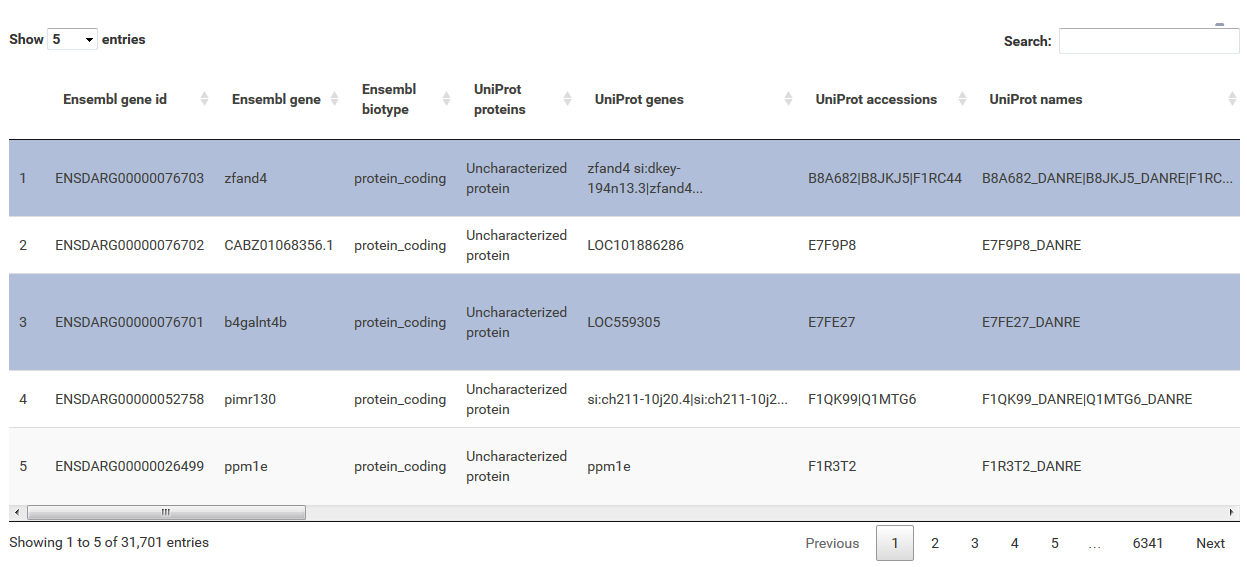
The table at the top of the "Feature Selection" page displays the current selection. It can be sorted ascending or descending according to any available data column. The selection can be narrowed down further by using the keyword search field on the top right of the table or by manual selection of rows (mouse click on row). Some cell values are truncated due to long text blocks('...'): to display these data just hover over the specific cell.

The current selection of features, as defined by the column filters below, can also be limited to the e.g. Top50 features according to a certain column value. This requires a previous sorting on the respective column to move the features inside the table into the correct order. This does NOT change the basket of selected features itself, but only limits the amount of features reported to the desired plot. As such it serves as a temporary sub-selection of the current selection of features as shown in the table. This functionality is controlled by a range slider, that can be used to select TopX/BottomX of features according to the current order. In combination with numeric filtering on e.g. fold changes, this can be used to e.g. generate a list of the Top50 up and down regulated genes (an operation often asked for by users).
Based on the column's content (text, numeric) WIlsON's Feature Selector will provide appropriate filter interfaces to enable an efficient way to select data. These are split among the levels of data (feature, sample, condition, contrast) given in the input data. Please make sure to press the SELECT button after your are content with your filters to update the basket!
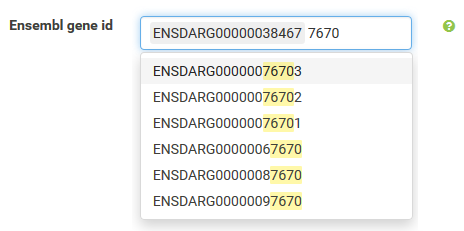
Annotations can be filtered by clicking a dropdown menu containing all available values. The filter box supports querying using partial key words as well. 'Backspace' can be used to deselect prior selections.

This filter is intended to select a numeric range. The 'inner' or 'outer' options allows the definition of either the range within the set markers (inner) or outside of the marker (outer), which is also displayed trough the slider coloring. As the step size is scaled according to the spread of the data (total range), editable value fields aside the slider can be utilized to change the minimum and maximum value (slider range is recalculated). This can be used to fine-tune the filter to e.g. use a very small value when the total range of the column is large. IMPORTANT: the slider defines the filter, not the value fields aside the slider.
The "highlight" pane supports the creation of a subset of the selected features. The highlighted data can be used in certain plots which support highlighting (e.g. scatterplot) to either add colors or labels. The highlight pane just populates, if features were already selected.