Local usage:Input format
CLARION (generiC fiLe formAt foR quantItative cOmparsions of high throughput screeNs) is a data format especially developed to be used with WIlsON, which relies on a tab-delimited table with some metadata to describe the columns. It is based on the Summarized Experiment format and supports all types of data which can be reduced to features (e.g. genes, transcripts, proteins, probes) and their annotation with assigned numerical values (e.g. count, score, log2foldchange, z-score, p-value). The feature annotations (e.g. symbol, GO category, KEGG pathways, etc.) and numerical values can later be used for filtering and plotting. Minimally, a row in such a table has to contain a unique identifier for the feature (e.g. gene accession) and one numerical value. Most result tables derived from RNA-Seq, ChIP/ATAC-Seq, Proteomics, Microarrays, and many other analyses can thus be easily reformatted to become compatible without having to modify the code of WIlsON for each specific experiment.
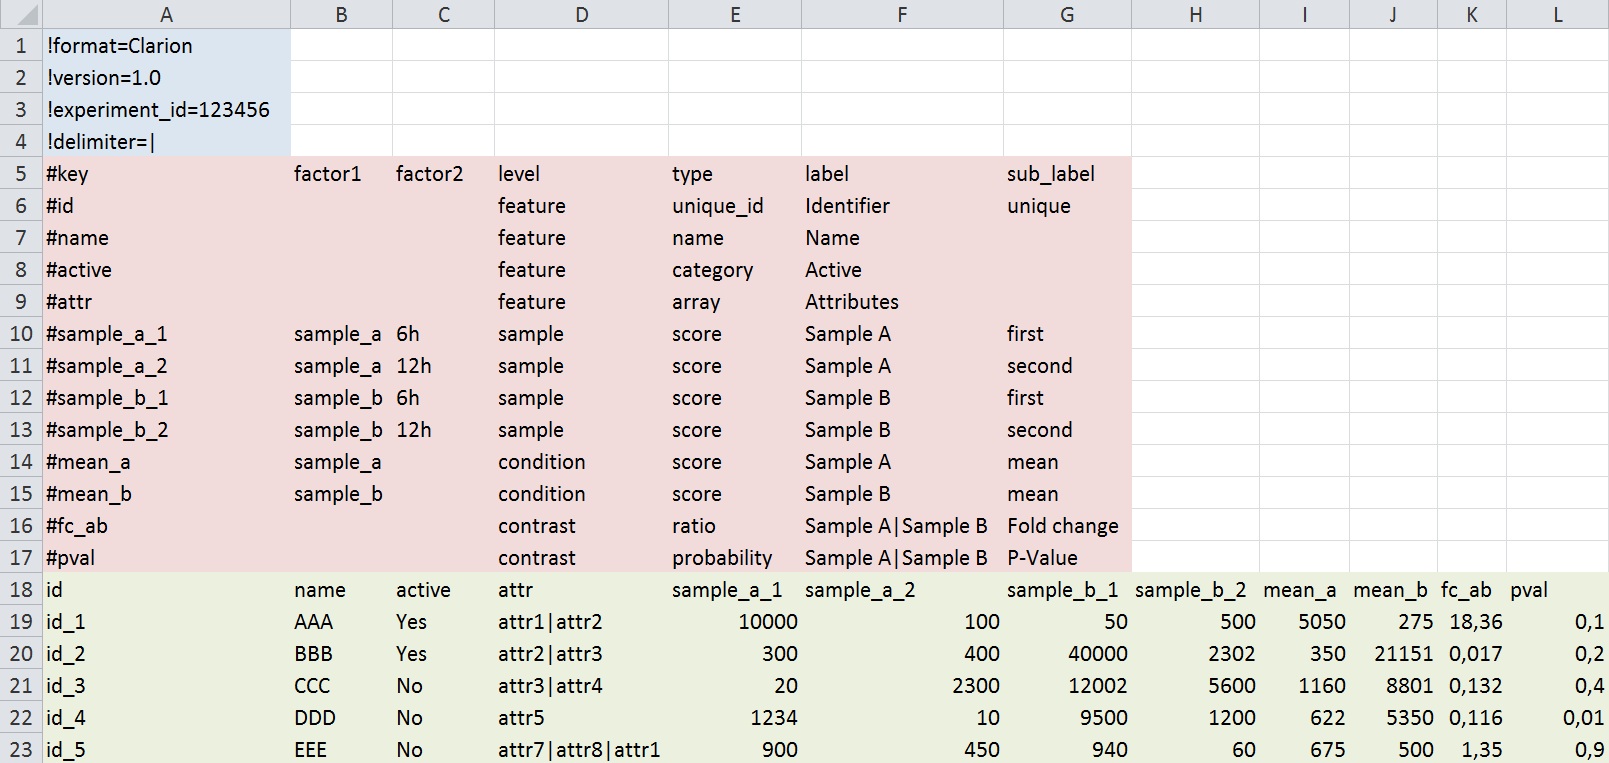
It is suggested to use a spreadsheet software (e.g. Excel) when performing a manual reformat of the original tab-delimited table (shown in green in the following figure) in order to avoid errors due to shifted columns. In order to become CLARION, two blocks of descriptive information have to be inserted above the original table called header (shown in blue) and metadata (shown in red).
The format of the three blocks follows distinct structures:
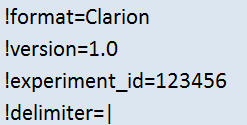
- Header (blue): Used to describe parameters concerning the global experiment. Most of these are for connection to surrounding workflows and can be ignored. Each header line starts with a '!' character.
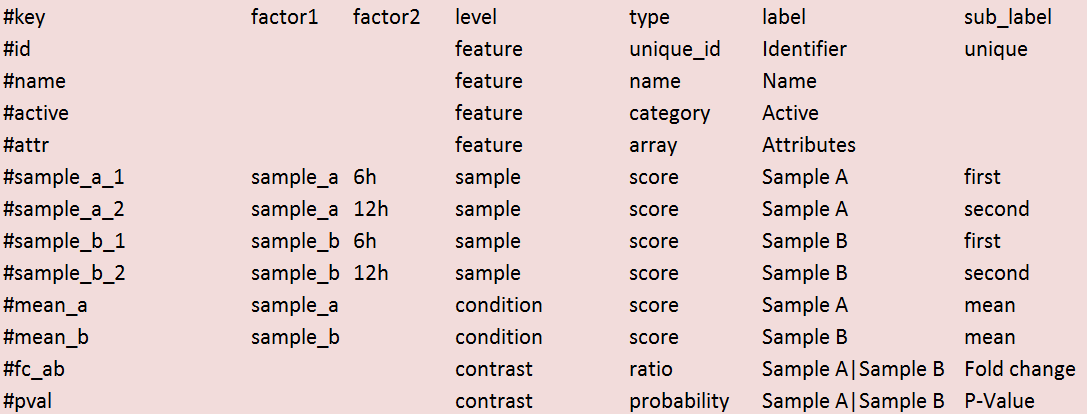
- Metadata (red): Contains the description of the content of each data column. Most importantly, each column is categorized into 4 different levels: feature (= annotation; can only be used for filtering and plot labeling) or one of sample, condition, contrast (= numeric values; can be used for filtering and plotting). The grouping of the numeric values into multiple levels is intended to simplify later user selections inside the web interface and has no further use as of now. The type category designates e.g. the unique identifier column (unique_id) and the column having the default name for the feature (name). The remaining categories (factor/label/sub_label) are optional and mostly change the labels shown inside the web interface. Each metadata line starts with a '#' character.
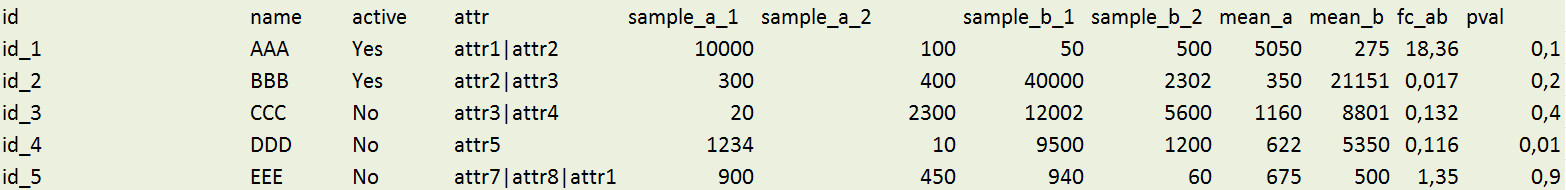
- Data (green): Matrix of tab-delimited data columns bearing text and numerical information per feature (= the original table).
- Line identifier:
! - Syntax:
name = value
Mandatory columns are marked with an asterisk (*) in the following description.
- format: Name of the file format (must be Clarion)
- version: Version of the file format (1.0)
- experiment_id: Unique id to be used for the experiment
- delimiter (*): In-field delimiter for multi-value fields (e.g. multiple KEGG pathways). Multi-character delimiters are possible (e.g. ", "). This permits filtering according to the single elements found in this column (e.g. "regulation of transcription, transporter activity" would be interpreted as having the separate values "regulation of transcription" and "transporter activity").
Information considering the nature of columns of the following original data table. Columns that are not described in the metadata section are ignored by WIlsON.
- Line identifier:
#
Mandatory columns are marked with an asterisk (*) in the following description.
-
key (*):
- Reference to data matrix (column headline)
- Must be unique
-
factor1 - factorN:
- Denotes experimental factors (e.g. genotype, time point, experimental step) per sample and condition
- One or more columns (factor1, factor2, ..., factorN)
- Used for grouping of samples (e.g. to calculate a standard deviation for multiple samples of a condition in a box plot)
- Optionally name each factor using the scheme:
factor1="name"
-
level (*):
- Classifies content of column
- Must be one of:
- sample: Data relating to a single sample
- condition: Data relating to a single condition (combination of all samples; e.g. average count)
- contrast: Data relating to a single contrast (pairwise comparison of conditions)
- feature: Annotation relating to a feature (e.g. gene, transcript, probe, protein, ...)
-
type (*):
- Mandatory for multi-value fields
- Further classify content level
- Must be one of:
- For level = feature = values to be filtered for
- unique_id: Unique identifier (e.g. ENSMUSG00000023944)
- name: Main feature name / symbol / label (e.g. Hsp90ab1)
- category: Single value per field; categorical data (e.g. protein_coding)
- array: Multiple delimited values per field; categorical data (e.g. Cholinergic synapse|Choline metabolism in cancer)
- For levels = sample, condition, contrast = values to be plotted
- score: count, intensity, ...
- ratio: foldchange, log2foldchange, ...
- probability: pvalue, padj, ...
- array: Multiple numeric values per field; e.g. coverage/windows, ...
- Attention: if the type is not given, the first feature column is expected to hold a unique identifier!
-
label:
- Optional label alternative to column name
- Can be used for plotting
- Should be unique
- For level = contrast delimited by '|' (condition1|condition2)
-
sub_label:
- Optional more detailed label to offer a logical sub-selection of a column using the interface
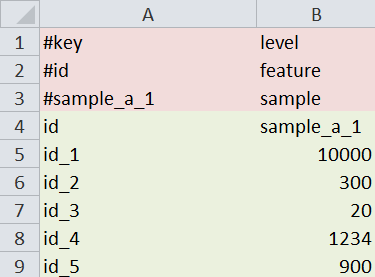
The original tab-delimited data matrix (in this example a modified DeSEQ output format).
- Minimum: one column with a unique id and one column with a numerical value
- If types are missing first column will be treated as unique_id
See this image for a cropped version of the example above. This example shows the minimum requirements needed for a valid CLARION file (metadata in red & data in green).