-
Notifications
You must be signed in to change notification settings - Fork 0
WIlsON modules
Jens Preussner edited this page Sep 23, 2019
·
3 revisions
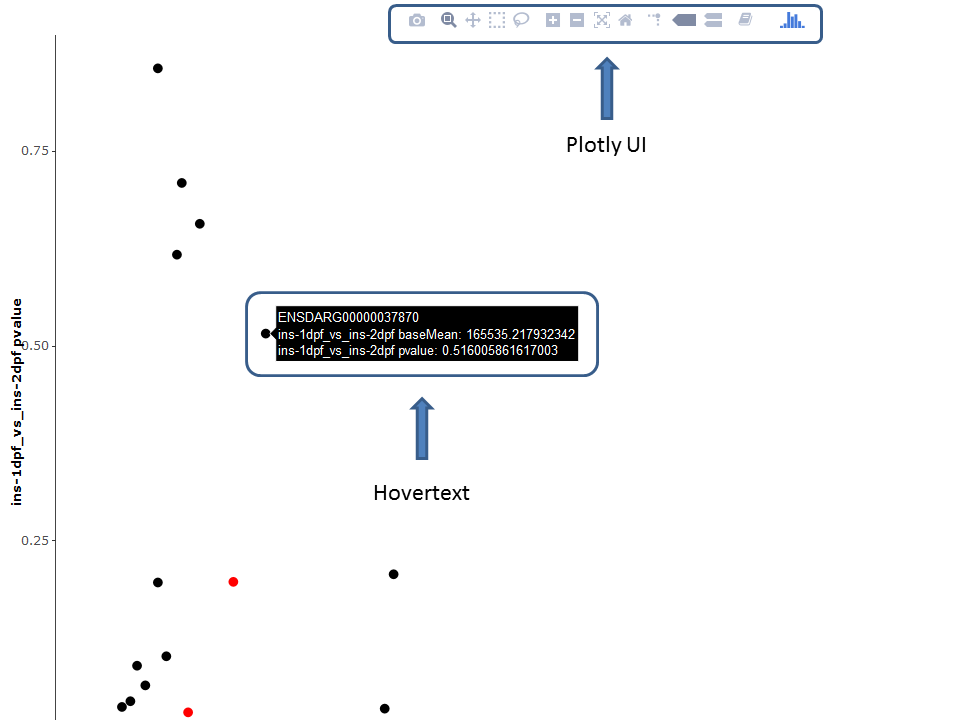
Thanks to the plotly package, several plots are available as interactive versions offering a range of additional options:
- Zoom / pan plot (either via UI or directly in plot)
- Mouse-over popup text box containing information of the selected feature
- Download currently selected viewport
It should be noted that the plotly versions are slower and more demanding on the processing power than the default ggplot2 versions.
- All interfaces include an interactive help section. Click on
 for a step by step tour on how to use the current interface.
 - Further details considering specific interface elements are available with the
 symbols.
How to cite?
H. Schultheis, C. Kuenne, J. Preussner, R. Wiegandt, A. Fust, M. Bentsen and M. Looso. WIlsON: Webbased Interactive Omics VisualizatioN. Bioinformatics 35(6) 2018, doi: https://doi.org/10.1093/bioinformatics/bty711
Copyright © 2019 Dr. Mario Looso, Max Planck Institute for Heart and Lung Research
