Interface overview
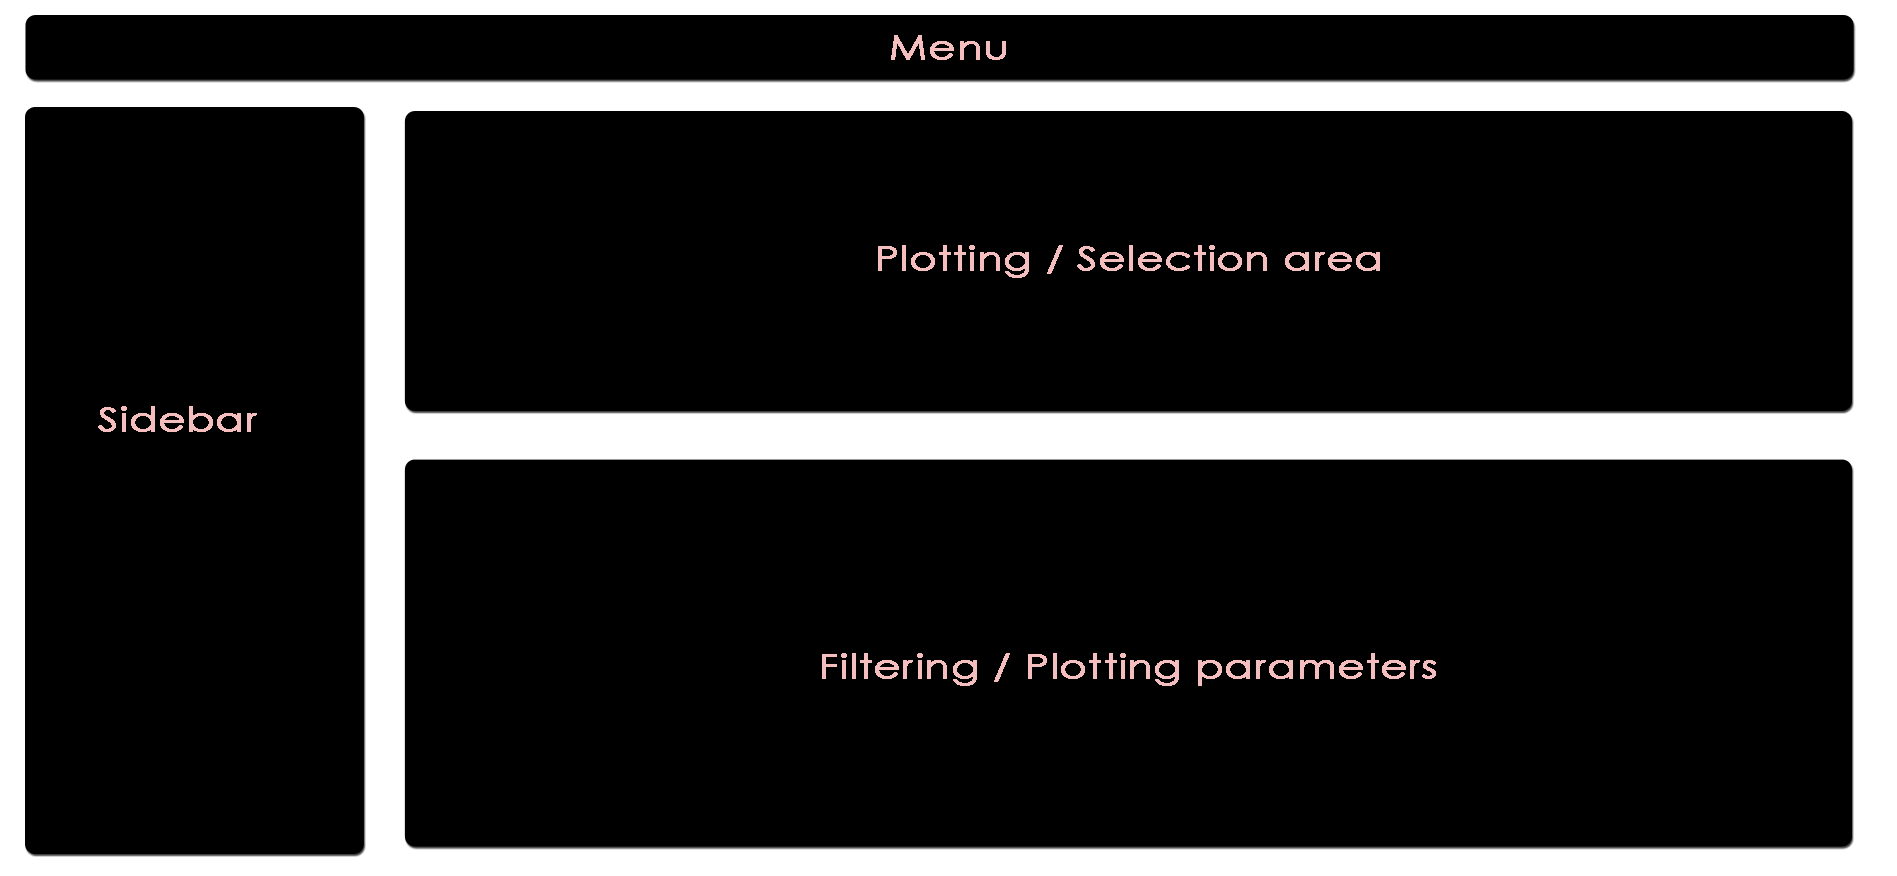
The app is separated into four main subsections, namely Menu (top), Sidebar (left), Plotting/Selection area (upper right) and Filtering/Plotting Parameter section (lower right). Depending on the selected pane in the menu, the sidebar, the plotting, and the filtering section might differ.
The menu provides links to available modules.
These two areas report on the current selection of features for default plotting (Selected Features) and special highlighting (Highlighted Features) including the respectively applied filters.
Global parameters are shown within the sidebar. For example, the input data file can be chosen here. Apart from various example data sets, the user can also upload custom data in CLARION format. When a distinct plotting type is selected in the menu, global parameters section can include image scaling factors, image size etc.
This area will show the result of the current rendering/filtering: either a plot or the data as a table.
The bottom interface contains most of the parameters defining a plot, including axis transformation, coloring etc.